3,124
Views
106
CrossRef citations to date
0
Altmetric
Articles

Emotional intelligence, coping and exam-related stress in Canadian undergraduate students

, &
Pages 42-50 | Accepted 01 Mar 2010, Published online: 04 Mar 2010

Figures & data

Table I. Descriptive statistics

Table II. Correlations among the study variables

Table III. Results of tests for age differences in EI, coping and stress

Table IV. Results of tests for sex differences

Table V. Scale-level factor analysis for EI and coping scales

Table VI. Correlations of factor scores with other measures

Figure 1. Conceptual form of the model for associations of personality and composite emotional intelligence/coping factors with stress.
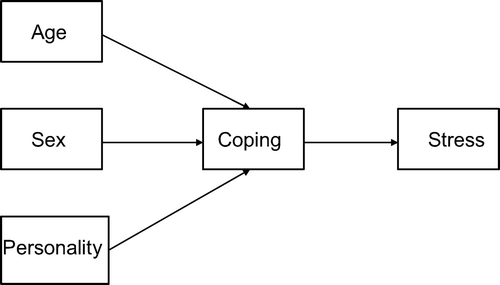
Figure 1. Conceptual form of the model for associations of personality and composite emotional intelligence/coping factors with stress.

Figure 2. Structural equation modelling model for stress. For clarity some correlations included in the model are not shown in the diagram. These were correlations among the personality traits, and between the two composite factors. The values for these correlations from the model were: C/E = .22, N/E = −.27, N/C = −.34, factor correlation = .35. C = Conscientiousness; E = Extraversion; Emreg = Emotion Regulation factor; N = Neuroticism; StressW1, StressW2 = stress over past week at T1 (start of study), T2 (immediately before exames), respectively; StressY = stress over past year; Task = Task Focus factor.
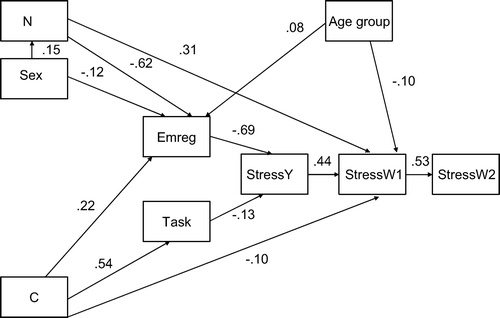
Figure 2. Structural equation modelling model for stress. For clarity some correlations included in the model are not shown in the diagram. These were correlations among the personality traits, and between the two composite factors. The values for these correlations from the model were: C/E = .22, N/E = −.27, N/C = −.34, factor correlation = .35. C = Conscientiousness; E = Extraversion; Emreg = Emotion Regulation factor; N = Neuroticism; StressW1, StressW2 = stress over past week at T1 (start of study), T2 (immediately before exames), respectively; StressY = stress over past year; Task = Task Focus factor.

Figure 3. Structural equation modelling model for SWB. A correlation between N and E was included in the model; its value was −.27. E = Extraversion; Emreg = Emotion Regulation factor; N = Neuroticism; SWB1, SWB2 = subjective wellbeing at T1 (start of study), T2 (immediately before exams), respectively.
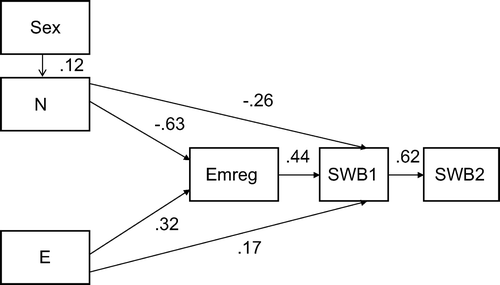
Figure 3. Structural equation modelling model for SWB. A correlation between N and E was included in the model; its value was −.27. E = Extraversion; Emreg = Emotion Regulation factor; N = Neuroticism; SWB1, SWB2 = subjective wellbeing at T1 (start of study), T2 (immediately before exams), respectively.

Reprints and Corporate Permissions

Please note: Selecting permissions does not provide access to the full text of the article, please see our help page How do I view content?

To request a reprint or corporate permissions for this article, please click on the relevant link below:

Academic Permissions

Please note: Selecting permissions does not provide access to the full text of the article, please see our help page How do I view content?

Obtain permissions instantly via Rightslink by clicking on the button below:

If you are unable to obtain permissions via Rightslink, please complete and submit this Permissions form. For more information, please visit our Permissions help page.