Figures & data
Figure 1. Publication types of the Australian Science Archives Project 1985–1992.
Notes: Archival guides 36%, conference papers 21%, newsletters 19%, client reports 19%, journal articles 5%. One book was published in 1991 but as this was significantly less than 1% of the output it is not shown on the chart.
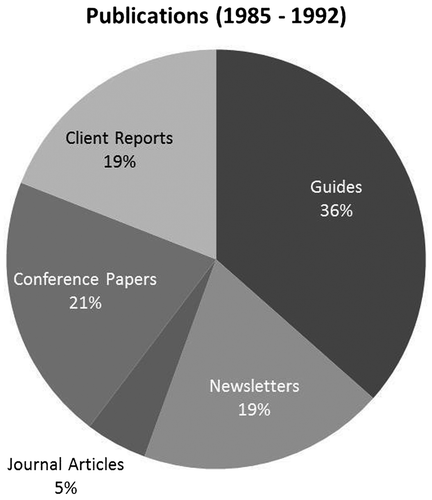
Figure 2. Publication types of the Australian Science Archives Project 1992–1999.
Notes: Client reports 37%, archival guides 22%, conference papers 16%, web resources 11%, journal articles 8%, newsletters 4%, books/book chapters 1%, other 1%.
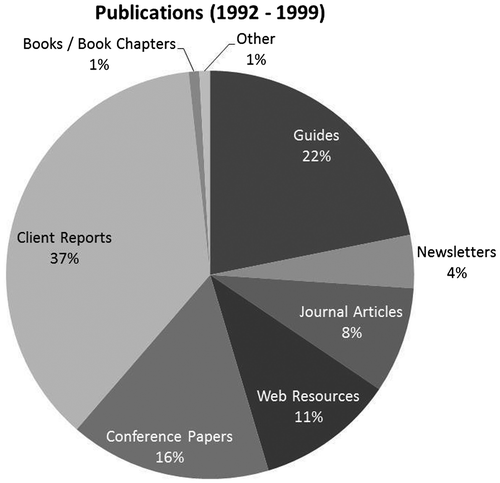
Figure 3. Publication types of the Australian Science and Technology Heritage Centre 1999–2006.
Notes: Archival guides 52%, conference papers 22%, journal articles 13%, web resources 7%, client reports 5%, other 1%.
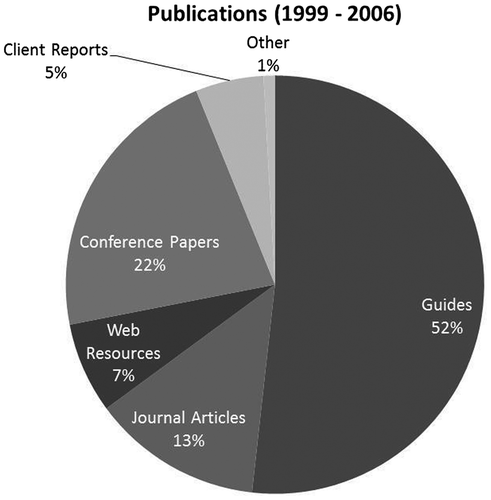
Figure 4. Publication types of the eScholarship Research Centre 2007–2013.
Notes: Archival guides 26%, conference papers 19%, client reports 17%, web resources 16%, journal articles 14%, books/book chapters 6%, other 1%.
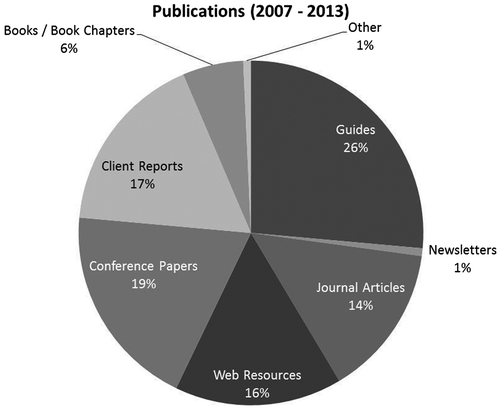
Figure 5. Publication types of the eScholarship Research Centre 2014–2015.
Notes: Archival guides 32%, conference papers 28%, journal articles 21%, web resources 9%, client reports 4%, books/book chapters 4%, other 2%.
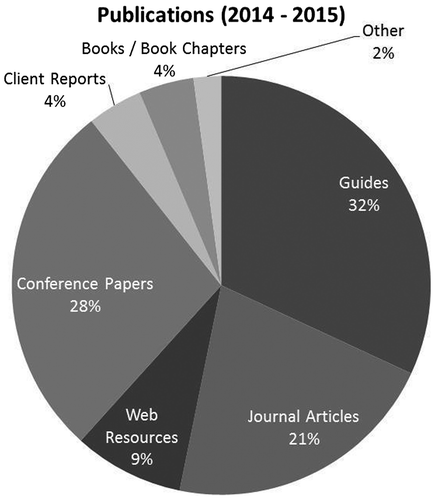
Figure 6. Number of projects, publications and staff registered in the ESRC projects register 1985–2015.
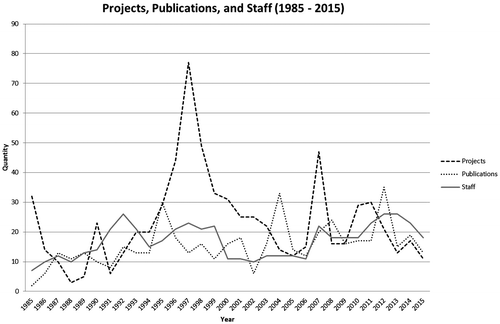
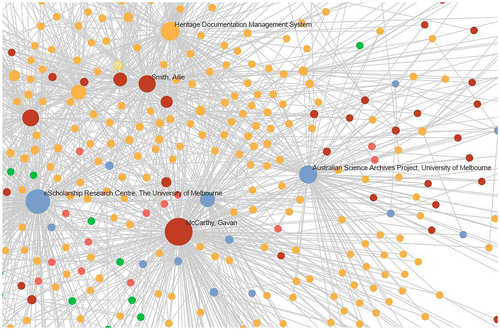
Figure 7. Detail from a network graph visualisation of the data from the ESRC project register.