
Figures & data
Table 1. Descriptive statistics, reliability statistics, and Pearson correlation matrix for demographic variables, emotion belief variables, and symptoms of depression, anxiety, and stress.
Figure 1. Path analysis modelling the relationship between emotion beliefs and depression, anxiety, and stress.
Solid lines indicate significant paths, dotted lines indicate nonsignificant paths. Age and gender were included in the path analysis but are not shown here. Higher scores on the EBQ variables indicate stronger beliefs that emotions are uncontrollable or useless.
Table 2. Results of path analysis predicting depression, anxiety, and stress symptoms.
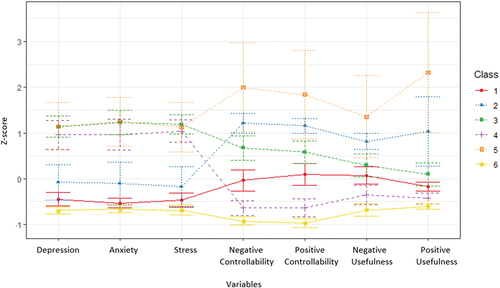
Figure 2. Visual representation of the six-profile solution from the latent profile analysis.
Error bars are 95% confidence intervals. Scores are standardised values (z-scores), where 0 = mean sample score, and 1 value above or below = one standard deviation above or below the mean. Profile 1 = “low symptoms/moderate maladaptive beliefs”, profile 2 = “moderate symptoms/moderate maladaptive beliefs”, profile 3 = “high symptoms/moderate maladaptive beliefs”, profile 4 = “high symptoms/low maladaptive beliefs”, profile 5 = “high symptoms/high maladaptive beliefs”, profile 6 = “low symptoms/low maladaptive beliefs”.
Supplemental material
Supplemental Material
Download MS Word (14.3 KB)Data availability statement
Data will be made available on request by contacting the corresponding author.