Figures & data
Figure 1. Flowchart diagram of the conventional teaching method.
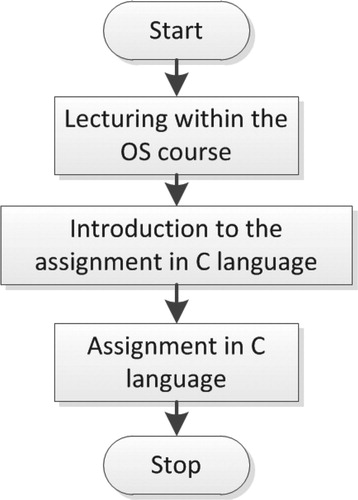
Table 1. Pseudocode of an individual assignment in the conventional teaching method.
Figure 2. Flowchart diagram of the experimental teaching method.
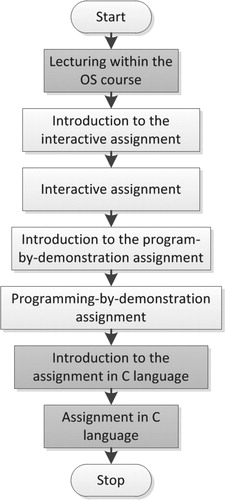
Figure 3. Widgets used in the mutual exclusion scenario: (a) The Account widget for appending of daily income to the company’s account; (b) Ordered Customer Serving widget for enforcing mutual exclusion.
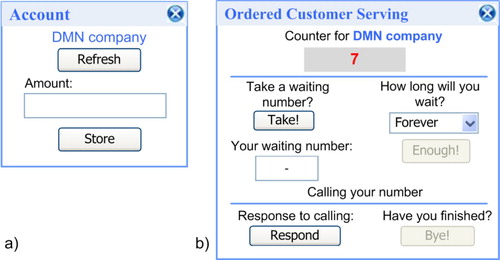
Figure 4. User manual to help participants to achieve mutual exclusion using the mechanism Ordered Customer Serving.
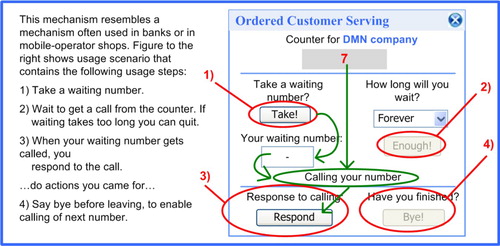
Figure 5. Programming of execution of actions upon reception of a signal with the Trigger widget.
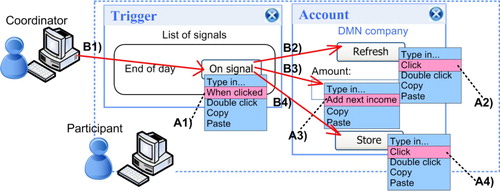
Figure 6. Solution of programming mutual exclusion over graphical interfaces of the mechanism Ordered Customer Serving.
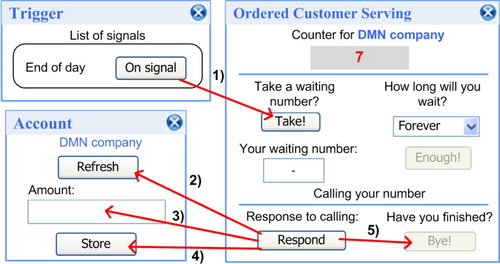
Figure 7. User manual to help programming of mutual exclusion of the mechanism Ordered Customer Serving.
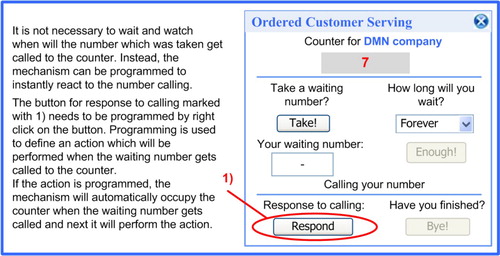
Figure 8. Histogram displaying time-on-task results of conventional method.
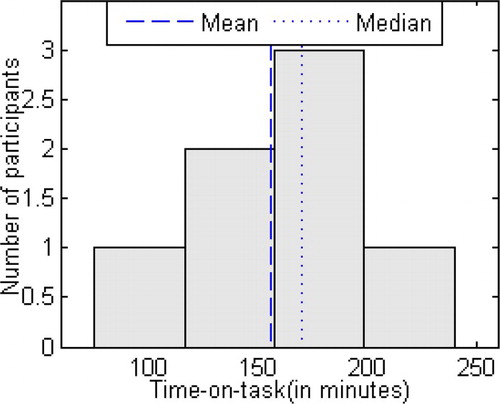
Table 2. Metrics showing results of conventional method (mean, median, and standard deviation are displayed in minutes).
Table 3. Metrics showing results of experimental method (mean, median, and standard deviation are displayed in minutes).
Figure 9. Histograms displaying time-on-task for the following: (a) overall learning process in the experimental method; (b) the inteactive assignment only; (c) the programming-by-demonstration assignment only; d) the assignment in C language only.
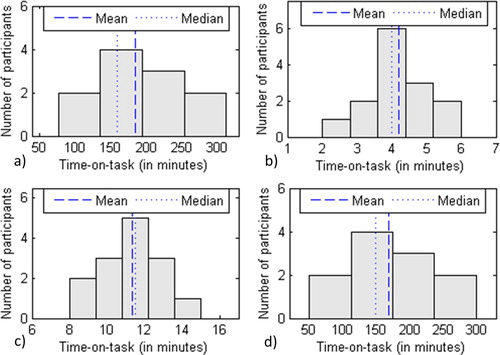
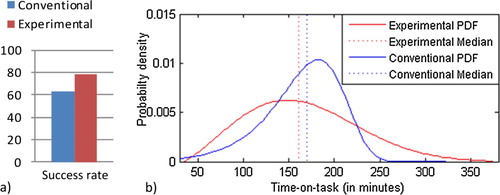
Figure 10. Side-by-side comparison of (a) success rate of the Conventional and the Experimental sample; (b) estimated probability density functions (PDF) of time-on-task for the Conventional and the Experimental sample.