Figures & data
Figure 1. The process of two channel quadrature mirror filter bank.
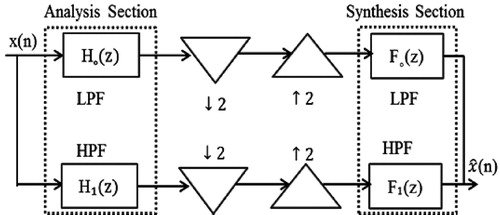
Figure 2. Flow chart of HBCT technique.
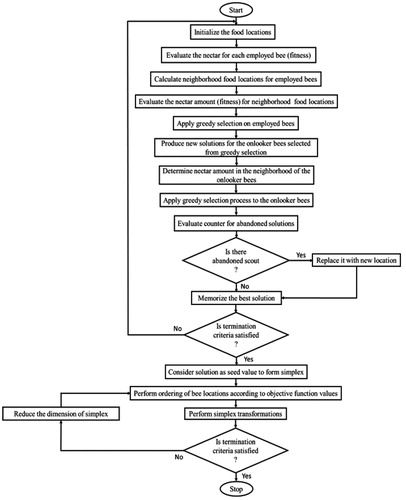
Table 1. The coefficients of prototype filter after optimization (N = 48).
Figure 3. Normalized magnitude response of the analysis filters for N = 48.
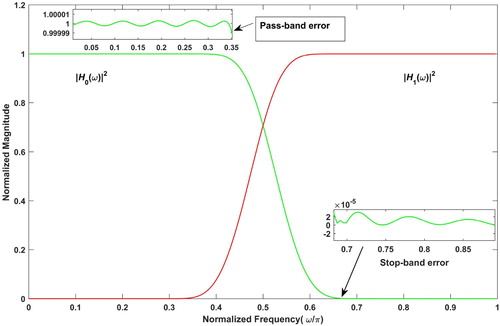
Figure 4. Reconstruction error for filter bank designed using prototype filter of order N = 48.
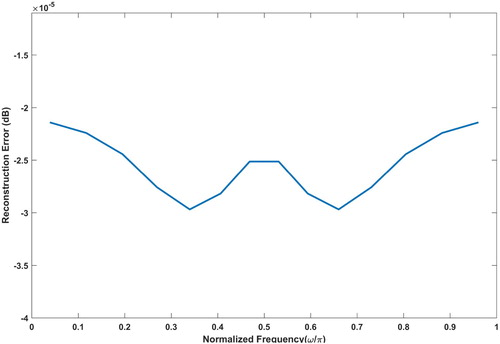
Table 2. The coefficients of prototype filter after optimization (N = 32).
Figure 5. Normalized amplitude response of analysis filters for N = 32.
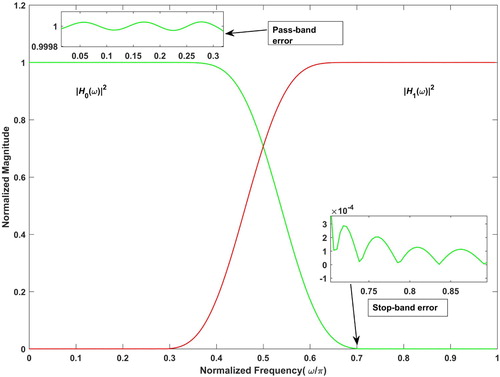
Figure 6. Reconstruction error.
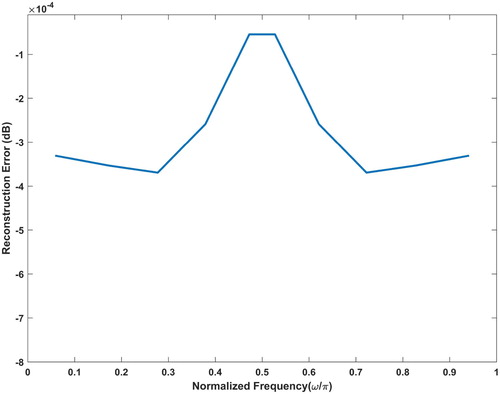
Table 3. The coefficients of prototype filter after optimization (N = 24).
Table 4. Comparison of proposed technique with existing optimization techniques for N = 48.
Figure 7. Normalized amplitude response of analysis filters for N = 24.

Figure 8. Reconstruction error.
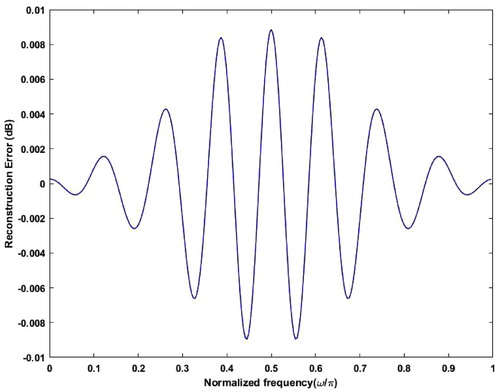
Table 5. Comparison of proposed technique with existing optimization techniques for N = 32.
Table 6. Comparison of proposed technique with existing optimization techniques for N = 24.
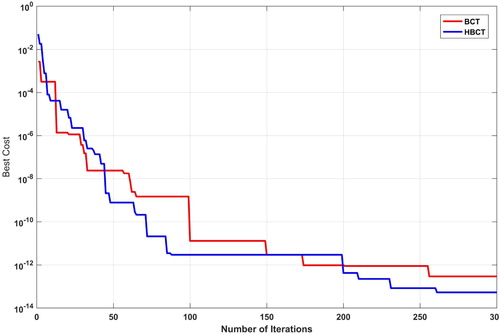
Figure 9. Convergence plot for proposed HBCT and BCT techniques.