
Figures & data
Figure 1. The inverted pendulum system.
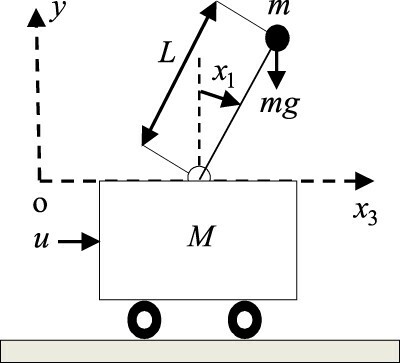
Figure 2. Configuration of the modified state-feedback control.
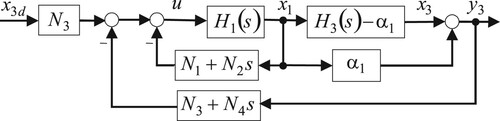
Figure 3. CIP servo system with internal model and state estimator.
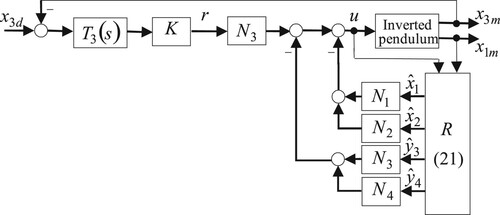
Figure 4. Configuration of the proposed output-feedback-based CIP servo system.
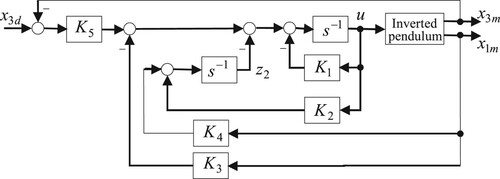
Table 1. Gains of the state-feedback controllers.
Figure 5. Pendulum angle and cart position responses using SSF, LQR, and TPD methods.
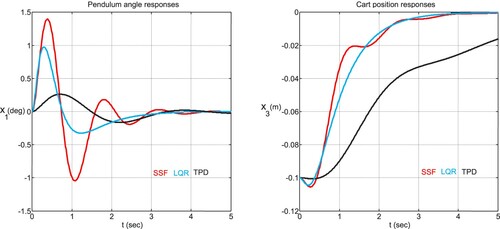
Figure 6. Control input responses using SSF, LQR, and TPD methods.
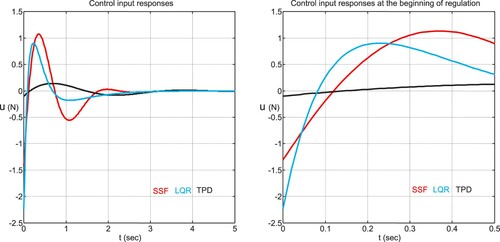
Table 2. Performance comparison of the control methods.
Table 3. Lower and upper bounds of for SOF, MPD, and MLQ methods.
Figure 7. Effect of on the speed and average peak efficiencies for SOF, MLQ, and MPD methods.
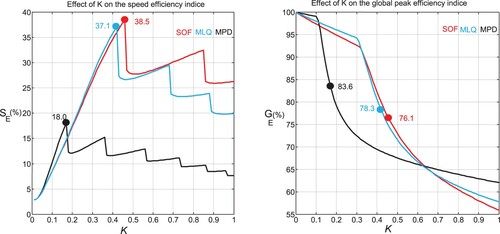
Figure 8. Pendulum angle and cart position responses using SOF, MLQ, and MPD methods.
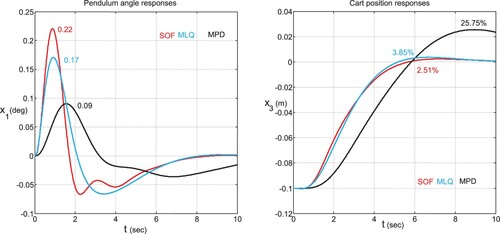
Figure 9. Control input responses using SOF, MLQ, and MPD methods.
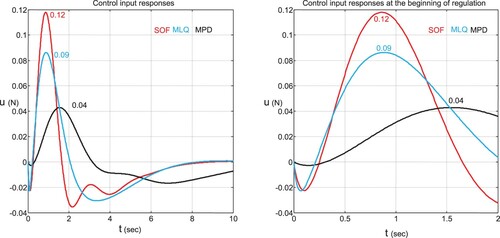
Figure 10. Effect of on the peak frequency and on efficiency indices for SFC and OFC methods.
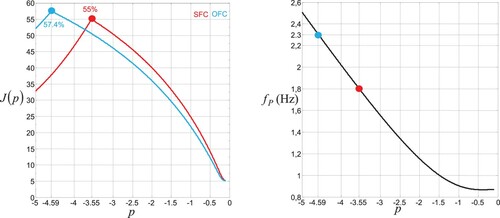
Table 4. Performance comparison of the SFC, OFC, and PID methods.
Table 5. Optimal gains for the SFC, OFC, and PID methods.
Figure 11. Pendulum angle responses in a noisy situation.
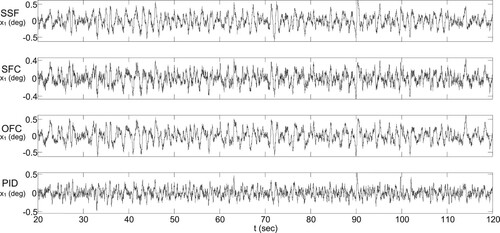
Figure 12. Cart position responses in a noisy situation.
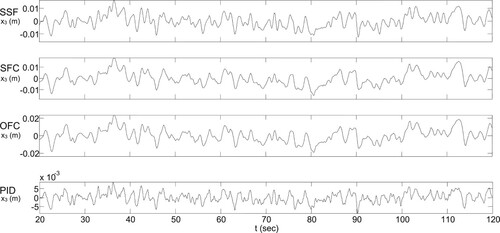
Figure 13. Control input responses in a noisy situation.
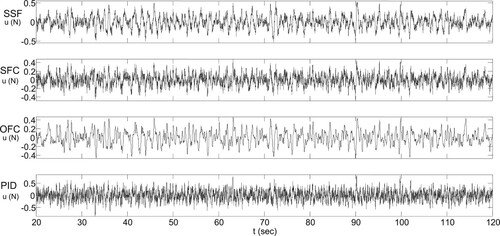
Table 6. Performance comparison in noisy situation.