Figures & data
Figure 1. Configuration of BLDC motor drive.
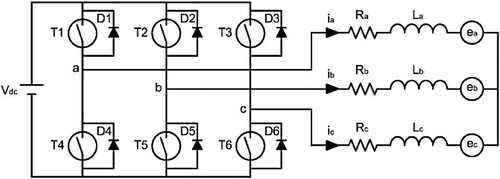
Figure 2. Change of trapezoidal back-EMF signals and corresponding desired phase currents.
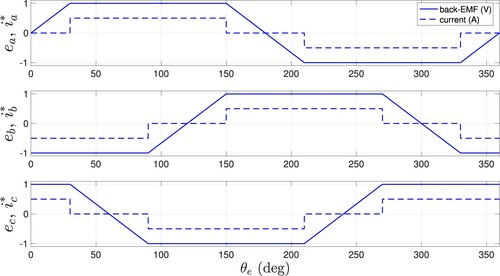
Figure 3. Form of the back-EMF signals: ,
,
.
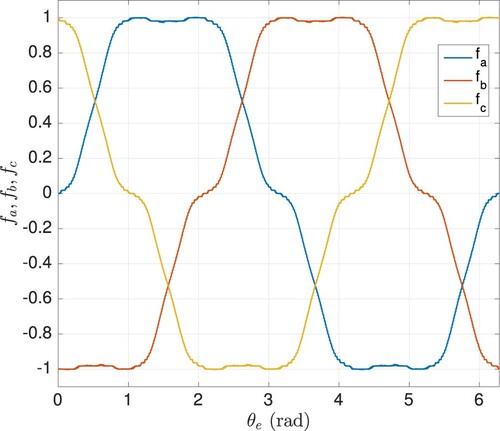
Figure 4. Results of Sim #1: Proposed controller with for
rpm. (a) The change of the output torque (top), reference and real conducting phase currents (middle), conducting phase voltage (bottom) and (b) The change of the periodic adapted parameter and its reference (top), adapted constant parameters (middle and bottom).
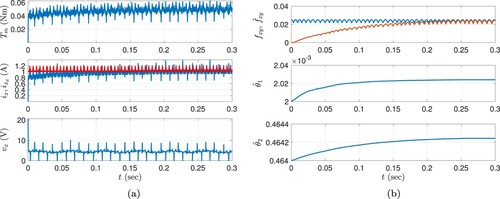
Figure 5. Results of Sim #2: Proposed controller with for
rpm. (a) The change of the output torque (top), reference and real conducting phase currents (middle), conducting phase voltage (bottom) and (b) The change of the periodic adapted parameter and its reference (top), adapted constant parameters (middle and bottom).
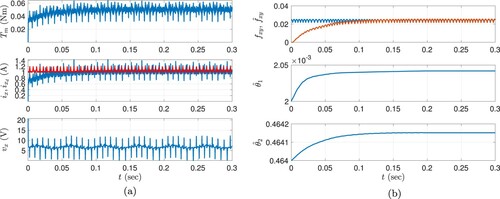
Figure 6. Results of Sim #3: Proposed controller with for
rpm. (a) The change of the output torque (top), reference and real conducting phase currents (middle), conducting phase voltage (bottom) and (b) The change of the periodic adapted parameter and its reference (top), adapted constant parameters (middle and bottom).
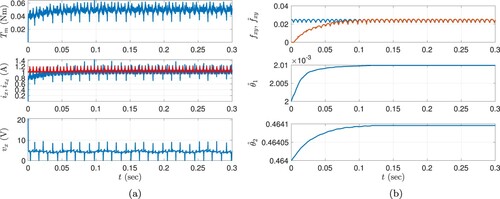
Figure 7. Results for the controller without adaptation. (a) Sim #4 ( rpm): The change of the output torque (top), reference and real conducting phase currents (middle), conducting phase voltage (bottom) and (b) Sim #5 (
rpm): The change of the output torque (top), reference and real conducting phase currents (middle), conducting phase voltage (bottom).
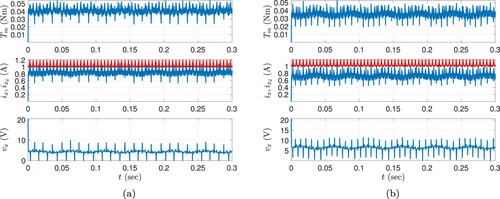
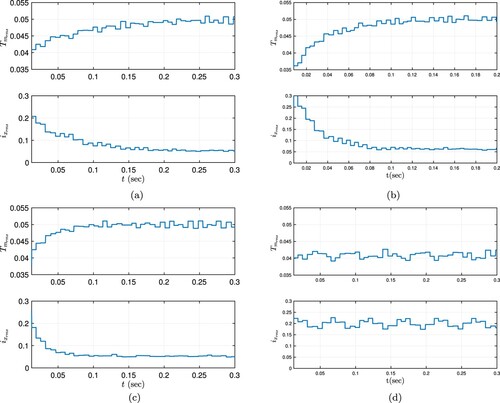
Figure 8. The change of RMS values of the output torque and the conducting current along the adaptation periods for Sim #1–Sim #4. (a) Sim #1: RMS of the output torque (top), RMS of the conducting phase current (bottom). (b) Sim #2: RMS of the output torque (top), RMS of the conducting phase current (bottom). (c) Sim #3: RMS of the output torque (top), RMS of the conducting phase current (bottom) and (d) Sim #4: RMS of the output torque (top), RMS of the conducting phase current (bottom).