
Figures & data
Figure 1. Simple FC polarization diagram [Citation6].
![Figure 1. Simple FC polarization diagram [Citation6].](/cms/asset/dca89ba1-2f1f-4bc5-abbd-876fe018494a/taut_a_2066768_f0001_ob.jpg)
Figure 2. FC electrical equivalent circuit.
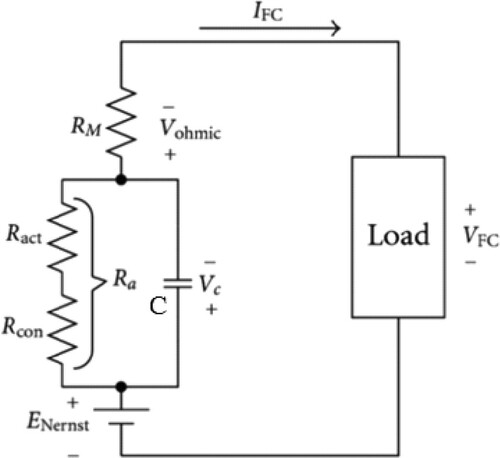
Figure 3. Simplified model of the FC system [Citation6].
![Figure 3. Simplified model of the FC system [Citation6].](/cms/asset/324e320c-780e-47c5-8bbe-d66ced4ca982/taut_a_2066768_f0003_oc.jpg)
Table 1. Parameters of the fuel cell used in the simulation [Citation6].
Figure 4. Schematic of the bidirectional DC/DC converter equipped with SMES [Citation32].
![Figure 4. Schematic of the bidirectional DC/DC converter equipped with SMES [Citation32].](/cms/asset/a7e94531-2059-4067-b391-97ca88dfe589/taut_a_2066768_f0004_oc.jpg)
Figure 5. Proposed control block diagram of the bidirectional DC/DC converter.
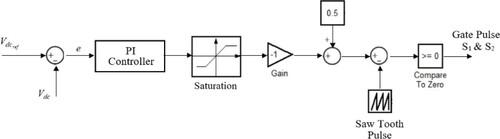
Figure 6. Schematic of the FC connected with bidirectional DC/DC converter with SMES.
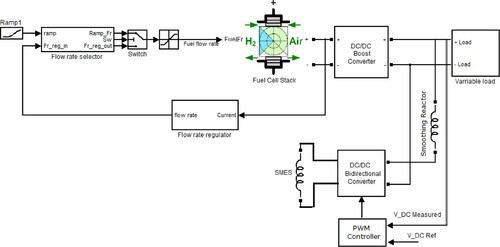
Figure 7. Load power increasing with and without SMES.
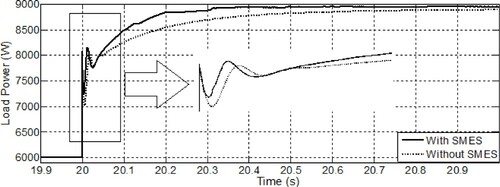
Figure 8. Load power decreases with and without SMES.
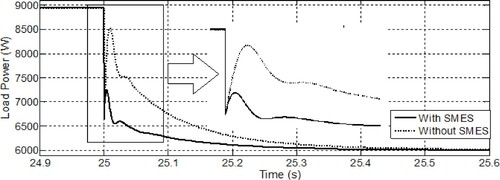
Figure 9. DC link voltage variation while load increasing with and without SMES.
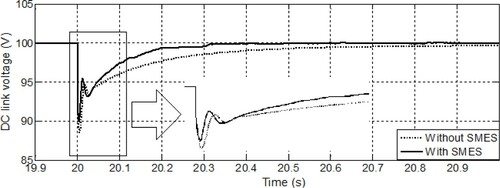
Figure 10. DC link voltage variation while load decreasing with and without SMES.
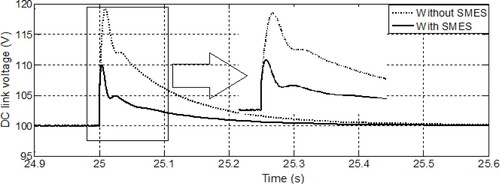
Figure 11. FC stack voltage variation with and without SMES.
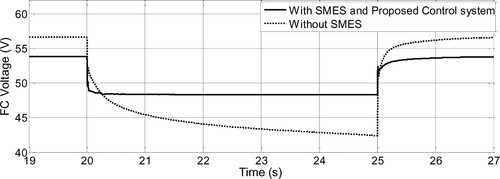
Figure 12. DC/DC converter output current.
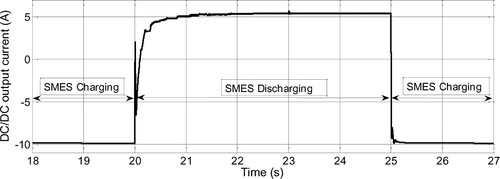
Figure 13. SMES current.
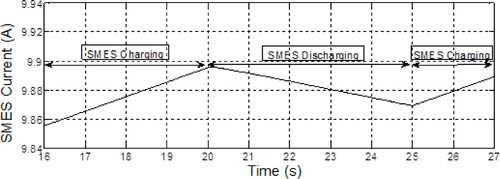
Figure 14. SMES voltage.
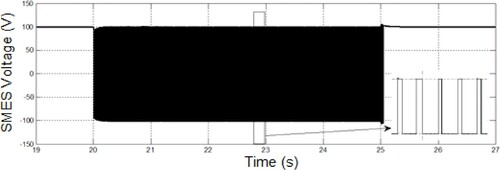
Figure 15. The H2 utilization factor during the load variation with and without SMES.
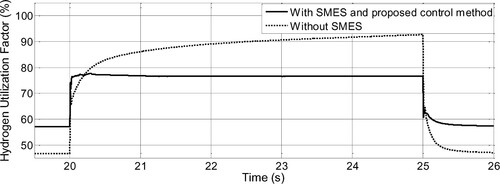
Table 2. Load response settling time comparison in presence and absence of the SMES with the proposed control system.