
Figures & data
Figure 1. Schematic representation of the proposed System.
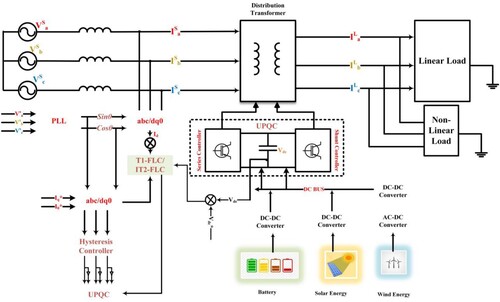
Figure 2. (a) Equivalent solar module model (b) Characteristics curve of P-V by INC technique.
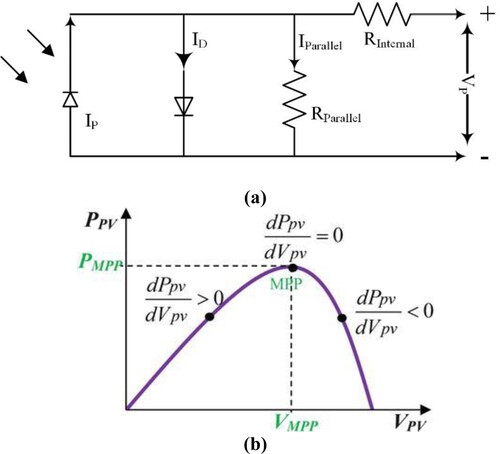
Figure 3. Description of the UPQC configuration.
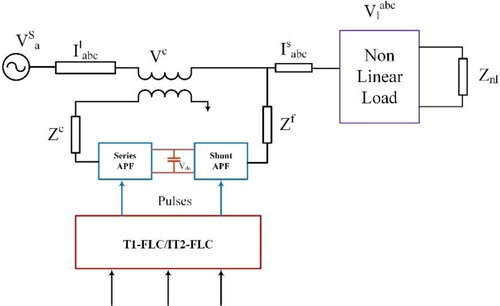
Figure 4. (a) General equivalent (b) UPQC equivalent (c) UPQC voltage compensation vector chart.
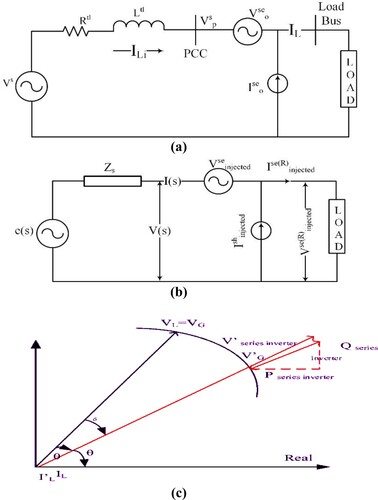
Figure 5. Diagrammatic representation for series active filter.
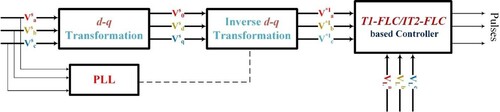
Figure 6. Diagrammatic representation of active shunt filter.
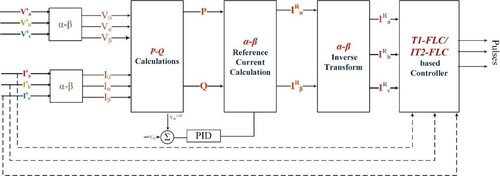
Figure 7. PID controller design.
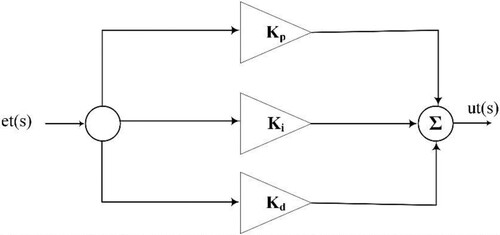
Figure 8. Type-1 Fuzzy Logic Controller Illustration.
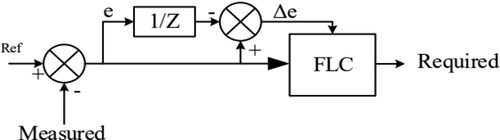
Figure 9. Errors and modifications in error editors using Gaussian MF.
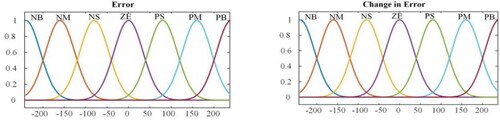
Figure 10. Gaussian MF output editor.
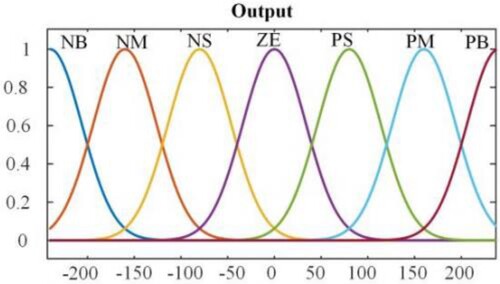
Figure 11. Diagrammatic Representation of Type 2 Fuzzy Logic Controller.
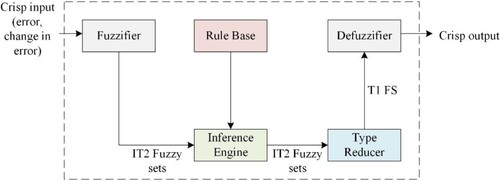
Figure 12. Gaussian MF error and variation in error editor.
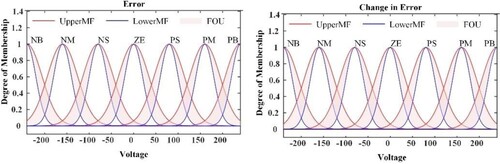
Figure 13. Output from the Gaussian MF editor.
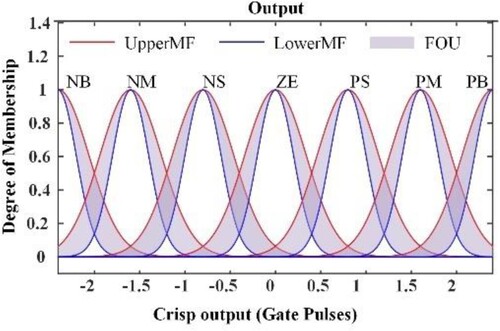
Table 1. Summary of mode 1 and mode 2 process simulated results.
Figure 14. (a) Active (P) power in kW (b) Reactive (Q) power in kVAR.
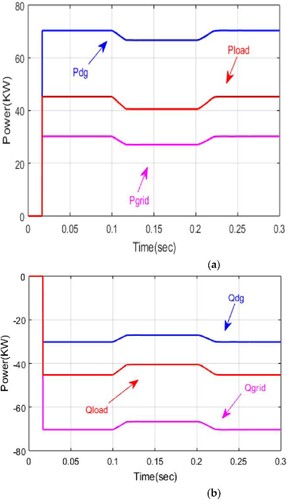
Figure 15. (a) Solar Irradiation (b) Wind Velocity (c) DG Power.
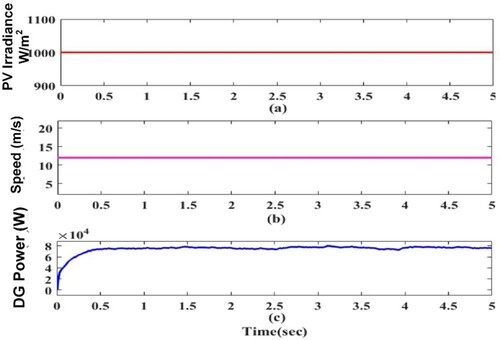
Figure 16. (a) Active (P) power in kW (b) Reactive (Q) power in kVAR.
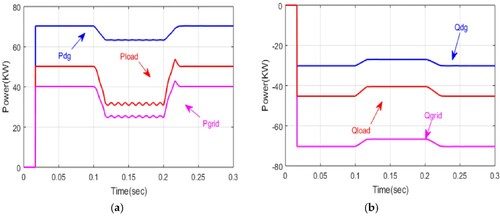
Figure 17. Point of common coupling voltage Vs, Grid current Is, Load current IL, Inverter Terminal current Ic.
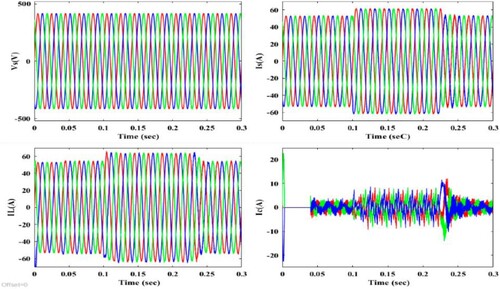
Figure 18. Point of common coupling voltage Vs, Grid current Is, Load current IL, Inverter Terminal current Ic.
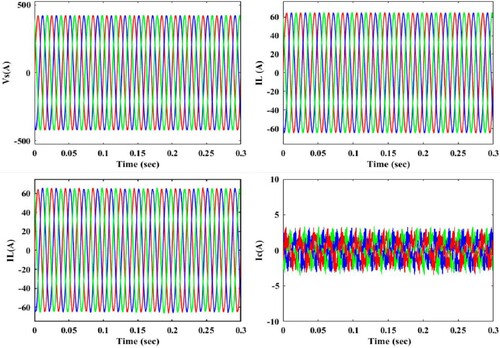
Figure 19. Investigation of Voltage sag situations (a) Grid Voltage (b) Load Voltage (c) Injected Voltage.
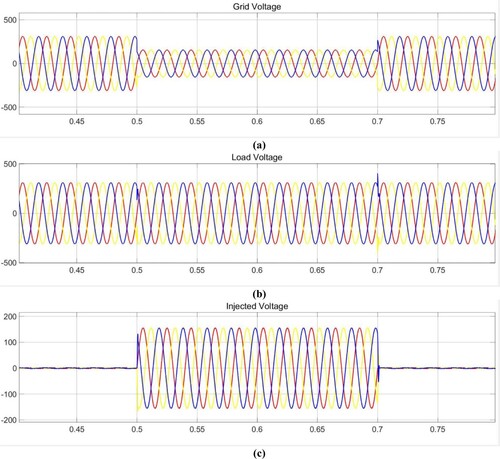
Figure 20. Investigation of Voltage swell situations (a) Grid Voltage (b) Load Voltage (c) Injected Voltage.
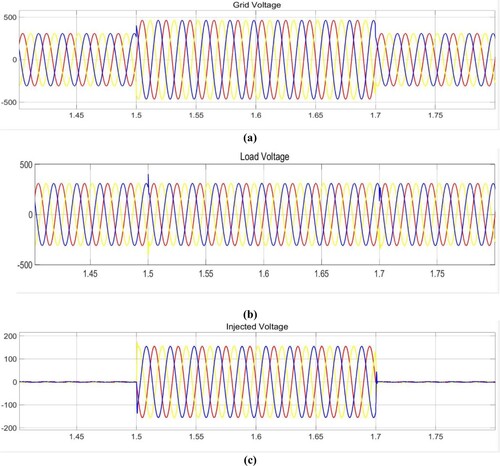
Figure 21. Total Harmonic Distortion for the proposed IT2-FLC system.
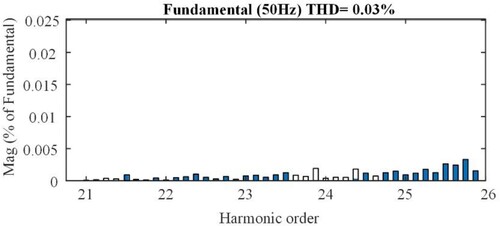
Figure 22. Suggested Real Power (P) comparison between several known optimization methods.
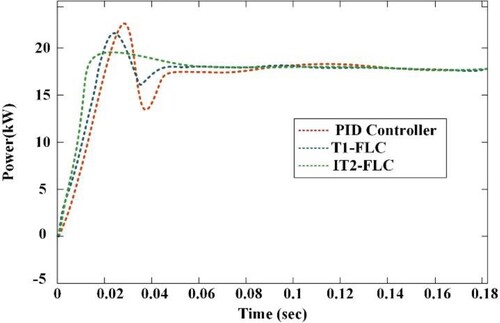
Figure 23. Suggested Reactive Power (Q) comparison between several existing optimization techniques.
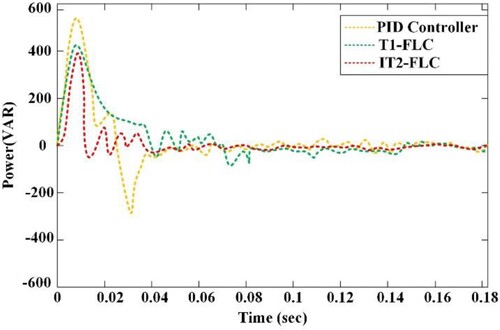
Table 2. Harmonic order comparison between before and After UPQC compensation.
Table A1. Rule base for the proposed Membership Functions.
Table A2. Specifications of Solar, Wind, and Battery.