Figures & data
Table 1. System physical specifications.
Figure 1. Reaction of the open-loop plant/system.
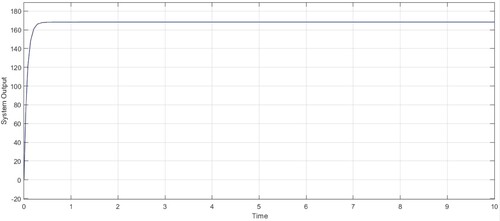
Table 2. The transfer function of the system based on the height of the tank.
Figure 2. Settings of the system.
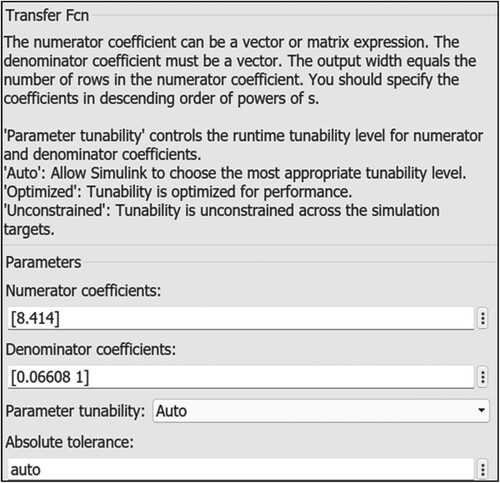
Figure 3. Response of the open loop with input.
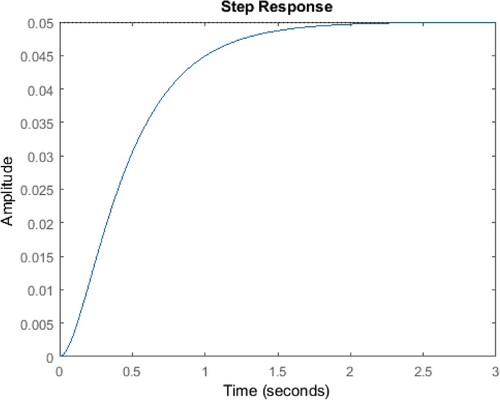
Figure 4. Step input to system.
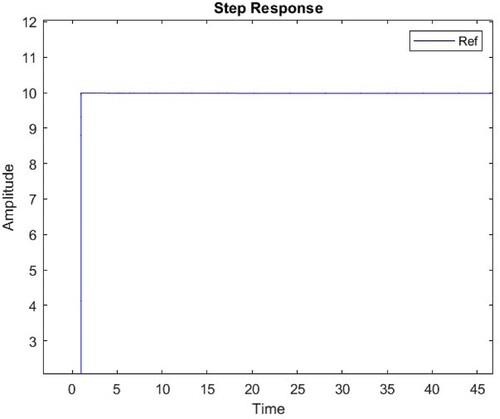
Figure 5. Response of the PID controller.
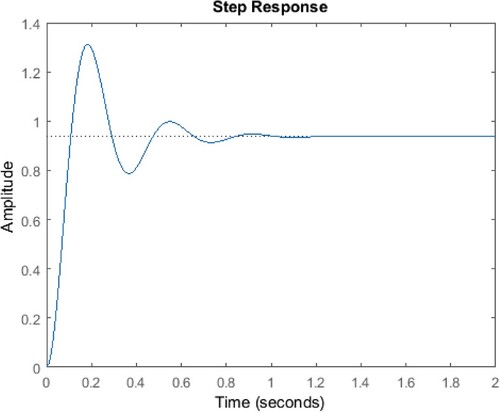
Figure 6. Fitness function of HSA with iteration.
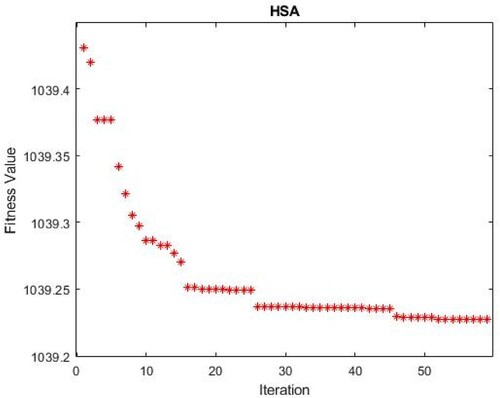
Figure 7. (a) Optimal response of HSA (b) Response of HSA with various set points (c) Error performance of the system.
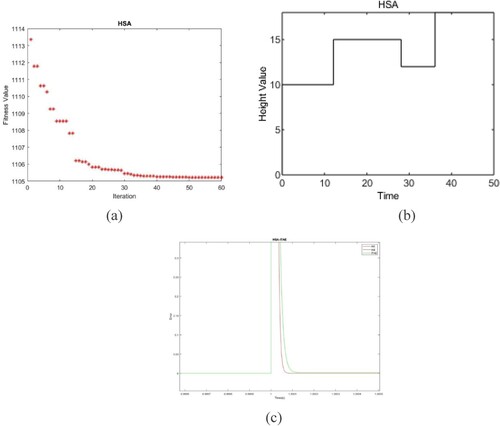
Figure 8. Output response of FOPID with system.
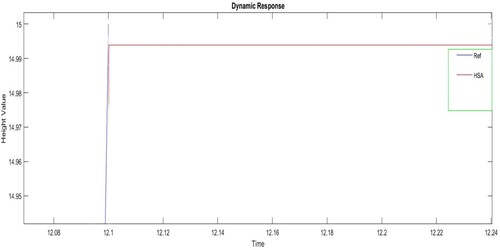
Figure 9. HSA convergence curve.
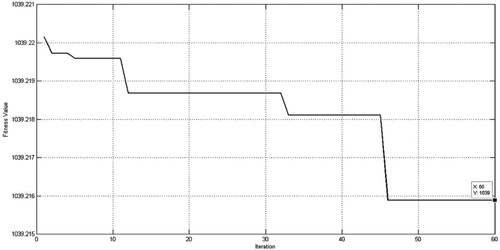
Table 3. Optimized gain for FOPID.
Table 4. Evaluation of the envisioned HAS-based system's dynamic responsiveness.
Figure 10. Bode diagram of conical tank between phase, magnitude, and frequency.
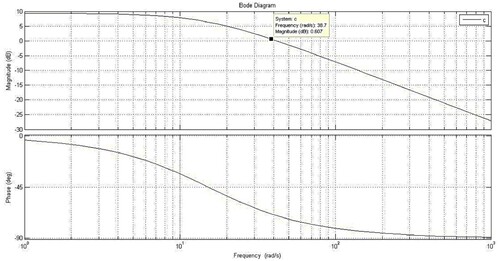
Table 5. Tank Transfer function.
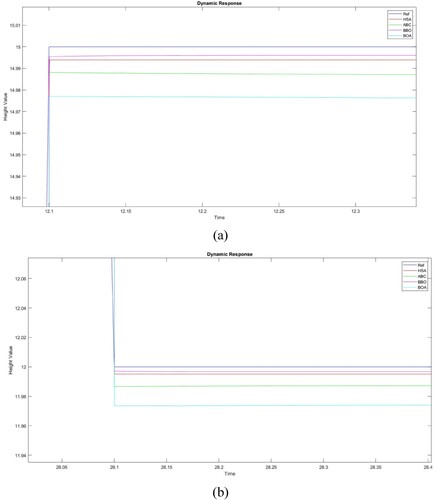
Figure 11. (a,b) Effect of supply disturbance in conical tank system.
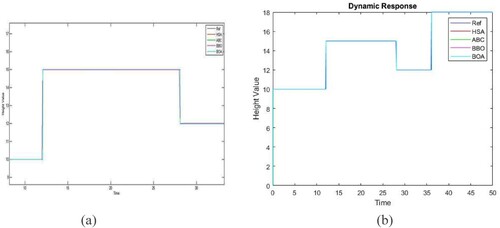
Figure 12. (a) Bode plot of model no.1 transfer function conical tank system (b) Bode plot of model no.2 transfer function conical tank system (c) Bode plot of model no.3 transfer function conical tank system (d) Pole-Zero Map of the conical tank design.
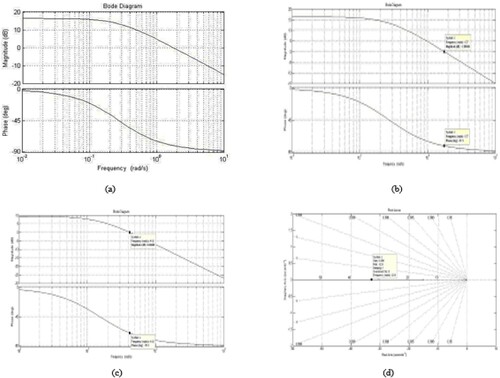
Figure 13. (a) Robust analysis plot (b) Robust analysis plot disturbance point.