Figures & data
Figure 1. Overall architecture of Swin VNETR.
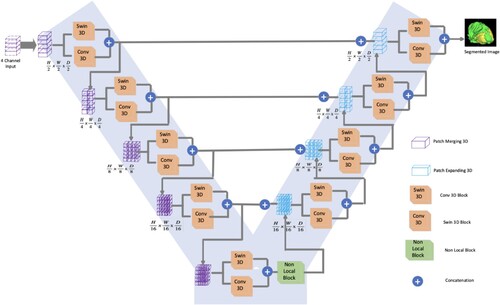
Figure 2. (a). Swin 3D blocks included W-MSA-3D and MLP, (b). 3D convolutional block.
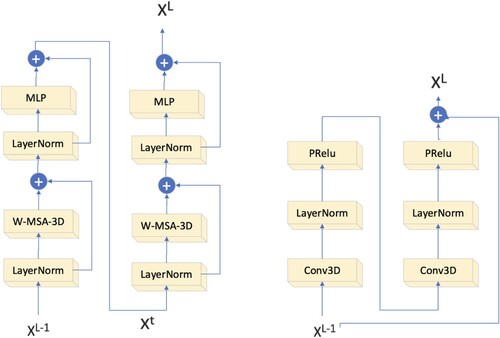
Figure 3. Structure of non-local block.
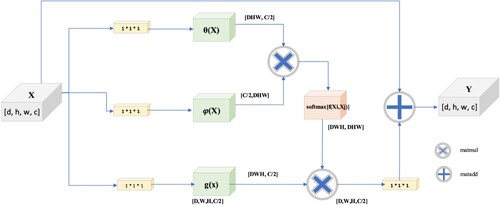
Figure 4. Flow diagram for proposed model execution.
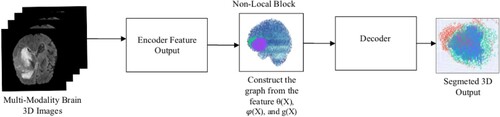
Figure 5. BraTs2021 native (T1) and post-contrast (T1Gd) T1-weighted (T1Gd) volumes, T2-weighted (T2) and T2-FLAIR volumes 3D MRI Images.
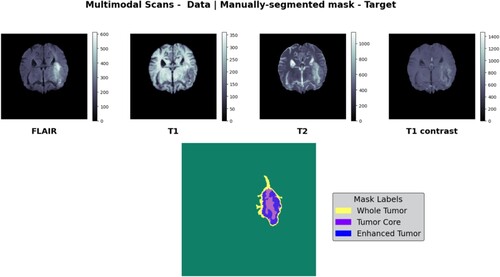
Figure 6. A) Brain image with tumour, B) Whole Tumor highlighted in green, C) Enhanced Tumor in yellow, D) Tumor Core in red, visualized using ITK-SNAP [Citation25] software tool used to view the brain tumour segmentation.
![Figure 6. A) Brain image with tumour, B) Whole Tumor highlighted in green, C) Enhanced Tumor in yellow, D) Tumor Core in red, visualized using ITK-SNAP [Citation25] software tool used to view the brain tumour segmentation.](/cms/asset/e70d16ed-7699-47ef-8f83-35a4e1e82b1b/taut_a_2374179_f0006_oc.jpg)
Figure 7. A. an Flair image as an input B. the ground truth of the validation data C. the feature extraction process during the Non-Local block D. the final segmented WT, TC, and ET.
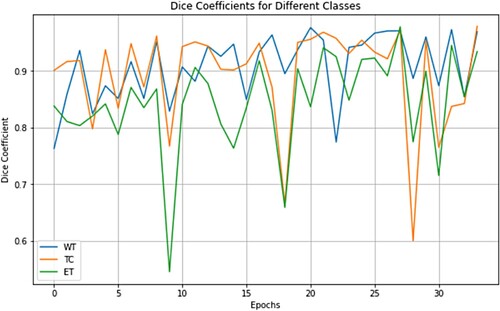
Figure 8. Curves illustrating the variation in Dice coefficients were used to assess the model's fitting capability on the validation dataset of Brats2021. These curves depict the Dice coefficients for the ET, TC, and WT channels.
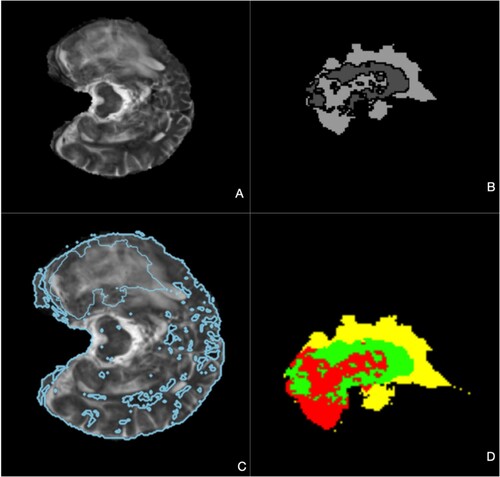
Table 1. Comparison table of brats 2021 validation dataset.
Table 2. p-value comparison table of all other model dice scores from Swin VNETR.
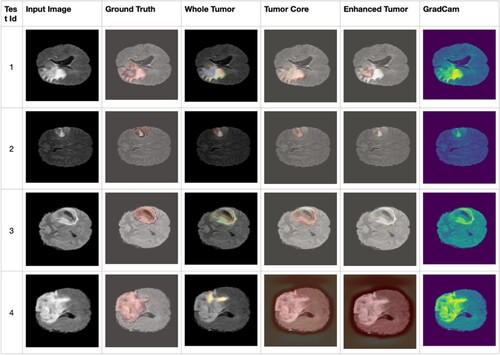
Figure 9. Visualization of Input Image, Ground Truth, Whole tumour, Tumor core, Enhanced Tumor, and Grad-CAM highlighted.