Figures & data
Figure 1. Frequency distribution of 802 studies reporting the percentage of bats in Barn Owl diet in Europe. Number above bars indicates the absolute number of studies.
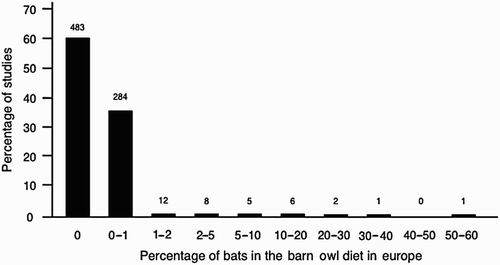
Table 1. Proportion of Barn Owl diet composed of bats in different European countries and islands.
Figure 2. Frequency of bats in Barn Owl diet in Europe in relation to latitude (a), longitude (b) and year (c). Predicted lines from an overall model (see text) are plotted.
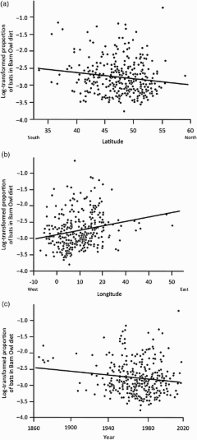
Table 2. Number of individuals and of regions (see list in Table 1) (N/#) where bats (identified to the species level) were found in the Barn Owl diet in Europe. For each identified species, we give information on hunting habitat, location of roosts and colonies, size of colonies, population status, population trend and body mass. Information on population status and trends are from IUCN 2012 (IUCN Red List of Threatened Species. Version 2012.2. <www.iucnredlist.org>). Biological data are from Dietz et al. (Citation2009) and data on wing loading and aspect ratio are from Norberg & Rayner (Citation1987).
Supplemental material