1,332
Views
9
CrossRef citations to date
0
Altmetric
Articles

A genetic screen of the island races of Wren Troglodytes troglodytes in the North-east Atlantic

, , , &
Pages 135-142 | Received 09 Nov 2013, Accepted 09 Feb 2014, Published online: 03 Apr 2014

Figures & data

Table 1. List of samples used for phylogenetic analysis.

Figure 1. The ranges of subspecies of Eurasian Wren sampled for this study.

Figure 1. The ranges of subspecies of Eurasian Wren sampled for this study.

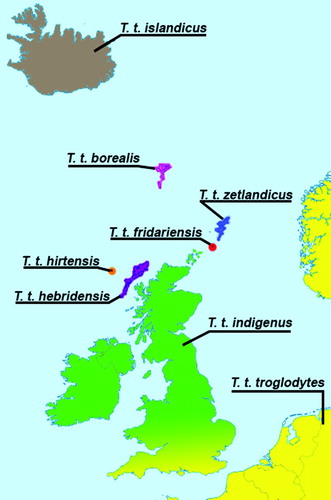
Table 2. Primers used to sequence the ND2 gene in T. troglodytes subspecies.

Table 3. Polymorphic nucleotide sites defining the 12 ND2 haplotypes resolved from the 33 T. troglodytes sequences examined. Sequences are given in relation to haplotype 1, where a dot indicates identity. The subspecies that each haplotype was found in is listed.

Figure 2. Minimum evolution (a) and neighbour joining (b) phylogenies of 13 Troglodytes ND2 haplotypes based on the Tamura–Nei distance with a gamma shape parameter of 1.31. Maximum parsimony (c) phylogeny shows most parsimonious tree with length = 58. Numbers at nodes denote bootstrap confidence indexes > 30%. Haplotype numbers (as per ) are given to the right of branch termini. T = nominate troglodytes, GB = birds from mainland Great Britain (troglodytes/indigenus), Z = zetlandicus, B = borealis and F = fridariensis.

Figure 2. Minimum evolution (a) and neighbour joining (b) phylogenies of 13 Troglodytes ND2 haplotypes based on the Tamura–Nei distance with a gamma shape parameter of 1.31. Maximum parsimony (c) phylogeny shows most parsimonious tree with length = 58. Numbers at nodes denote bootstrap confidence indexes > 30%. Haplotype numbers (as per Table 3) are given to the right of branch termini. T = nominate troglodytes, GB = birds from mainland Great Britain (troglodytes/indigenus), Z = zetlandicus, B = borealis and F = fridariensis.

Figure 3. Frequency distributions of nucleotide divergences between individuals of the same subspecies (white bars) and different subspecies (black bars).

Figure 3. Frequency distributions of nucleotide divergences between individuals of the same subspecies (white bars) and different subspecies (black bars).

Reprints and Corporate Permissions

Please note: Selecting permissions does not provide access to the full text of the article, please see our help page How do I view content?

To request a reprint or corporate permissions for this article, please click on the relevant link below:

Academic Permissions

Please note: Selecting permissions does not provide access to the full text of the article, please see our help page How do I view content?

Obtain permissions instantly via Rightslink by clicking on the button below:

If you are unable to obtain permissions via Rightslink, please complete and submit this Permissions form. For more information, please visit our Permissions help page.