413
Views
0
CrossRef citations to date
0
Altmetric
Articles

Predicting territory density of Dusky Orange-crowned Warblers Oreothlypis celata sordida breeding on Santa Catalina Island, California

Pages 474-483 | Received 15 Apr 2014, Accepted 11 Jul 2014, Published online: 10 Sep 2014

Figures & data

Figure 1. Illustration of the neighbourhood scale over which territory density was calculated as a dependent variable. The number of territories over a neighbourhood areas (dotted circles) was calculated, which was determined by averaged nearest neighbour distance from the randomly selected sampled grid. Grey polygons indicate individual territories, filled circles show sampled grids, and unfilled circles illustrate centres of territories.
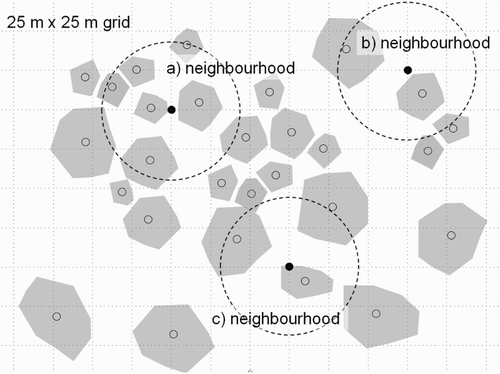
Figure 1. Illustration of the neighbourhood scale over which territory density was calculated as a dependent variable. The number of territories over a neighbourhood areas (dotted circles) was calculated, which was determined by averaged nearest neighbour distance from the randomly selected sampled grid. Grey polygons indicate individual territories, filled circles show sampled grids, and unfilled circles illustrate centres of territories.

Figure 2. Graphical summary of model calibration for the RT model to predict territory density of Dusky Orange-crowned Warblers in Bulrush Canyon, Santa Catalina Island, California, USA, in 2006–2008. (a) Cross-validated relative error rate as a function of the number of splits; the best-fitting model has two splits and exhibits the minimum misclassification rate and the smallest tree size. (b) Decision tree for the best-fit RT predicting neighbourhood density in relation to NDVI and oak coverage (%); splits are labelled with conditional cut-off values (e.g. If NDVI is less than 0.10, then territory density is 0.75 territories/neighbourhood. Otherwise, it is 2.36 territories/neighbourhood); nodes denote the predicted number of territories within a neighbourhood scale (with the converted territory density/ha in parentheses); and the number of cases assigned to parameterize the model (n).
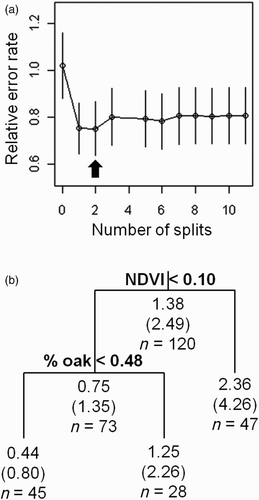
Figure 2. Graphical summary of model calibration for the RT model to predict territory density of Dusky Orange-crowned Warblers in Bulrush Canyon, Santa Catalina Island, California, USA, in 2006–2008. (a) Cross-validated relative error rate as a function of the number of splits; the best-fitting model has two splits and exhibits the minimum misclassification rate and the smallest tree size. (b) Decision tree for the best-fit RT predicting neighbourhood density in relation to NDVI and oak coverage (%); splits are labelled with conditional cut-off values (e.g. If NDVI is less than 0.10, then territory density is 0.75 territories/neighbourhood. Otherwise, it is 2.36 territories/neighbourhood); nodes denote the predicted number of territories within a neighbourhood scale (with the converted territory density/ha in parentheses); and the number of cases assigned to parameterize the model (n).

Figure 3. Territory density of breeding Dusky Orange-crowned Warblers on Santa Catalina Island as predicted by the best-fit RT model. Black dots indicate point count survey locations. Red polygons delineate areas burned by wildfires in 1999–2007.
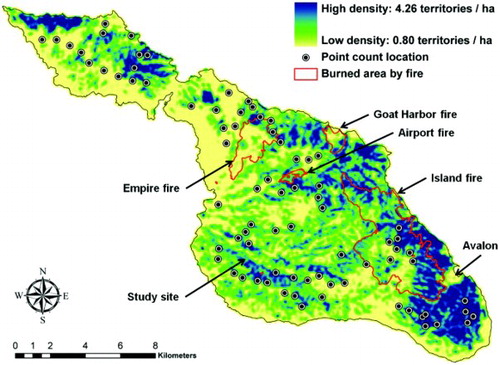
Figure 3. Territory density of breeding Dusky Orange-crowned Warblers on Santa Catalina Island as predicted by the best-fit RT model. Black dots indicate point count survey locations. Red polygons delineate areas burned by wildfires in 1999–2007.

Figure 4. Indirect evaluation of the RT model using habitat-specific distance sampling density estimates: territory density from the RT model and individual density from the distance sampling analyses. Each bar represents mean density estimate with 95% CIs with the number of survey points (see results for the statistics).
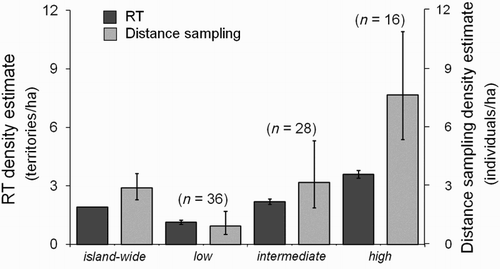
Figure 4. Indirect evaluation of the RT model using habitat-specific distance sampling density estimates: territory density from the RT model and individual density from the distance sampling analyses. Each bar represents mean density estimate with 95% CIs with the number of survey points (see results for the statistics).

Table 1. Estimated individual density of Dusky Orange-crowned Warblers on Santa Catalina Island, California, from surveys in May 2002–2006. Parameter and variance estimates taken from the model with the smallest second-order Akaike's Information Criterion (AICc; see Methods).

Reprints and Corporate Permissions

Please note: Selecting permissions does not provide access to the full text of the article, please see our help page How do I view content?

To request a reprint or corporate permissions for this article, please click on the relevant link below:

Academic Permissions

Please note: Selecting permissions does not provide access to the full text of the article, please see our help page How do I view content?

Obtain permissions instantly via Rightslink by clicking on the button below:

If you are unable to obtain permissions via Rightslink, please complete and submit this Permissions form. For more information, please visit our Permissions help page.