Figures & data
Figure 1. A history of range occupancy of 10 km squares is shown for Whinchat (a) and Stonechat (b). The symbols represent: black triangles: large = loss since 1988–1991, small = old loss since 1968–1972; red triangles: large = gains since 1988–1991, small = gains since 1968–1972; pink shading = present in all atlases (maps reproduced from Balmer et al. Citation2013 with permission from the British Trust for Ornithology). The change in abundance per 10 km square between the 1988–1991 and 2007–2011 atlases is also shown for Whinchat (c) and Stonechat (d), respectively (black spots = gains, white spots = losses). Four analytical ‘regions’ were defined: Scotland, Wales, Northern and Southern England.
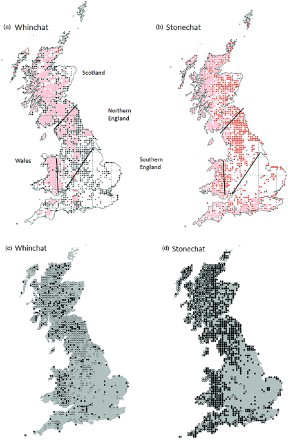
Figure 2. Change in the relative percentage of losses and gains of 10 km square occupancy between second and third atlases (broadly, 1990–2010) for Whinchat (a) and Stonechat (b) for four ‘regions’ of Britain.
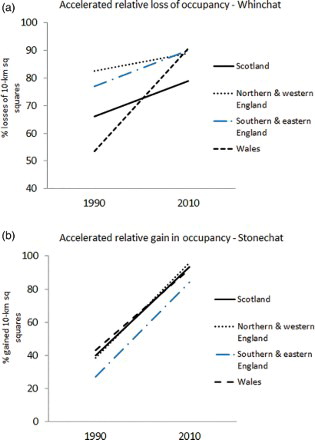
Table 1. A regional summary of the distribution of Whinchat and Stonechat atlas change values by land-class category. ‘Preference’ is the proportional occurrence (gains + losses) across land-classes relative to the proportional availability of each land-class category. ‘Difference’ refers to the difference between the proportions of gains to losses associated with each land-class category. The significance of the overall model for each category of ‘Preference’ or ‘Difference’ is given in column 5 with probabilities presented as **P < 0.001, ***P < 0.0001, meaning that significant differences were detected between land-class codes. Columns 2 and to 4 identify which land-class codes contributed to that overall result with a significant positive (+) or negative association (−) with the bird data, where P < 0.05. For those in parenthesis, P < 0.1. A summary description is given to help interpret which land-class characteristics emerged as contributing factors. For official definitions of each land-class code, see Bunce et al. (Citation1998).
Table 2. An analysis of the association between Land Cover Map and weather variables and the change in abundance of Whinchats and Stonechats in Britain between second and third atlas periods (broadly, 1990–2010). The statistics are Type 3, χ2 effect values and probabilities P. Model fit: dev./df = 1.02.
Figure 3. Density change between 1994 and 2011 for Whinchat and Stonechat. The dashed line shows the modelled 1994 distribution and the solid line shows the modelled 2011 distribution, in relation to (a and c) northing and (b and d) elevation. The triangles represent the peak densities for each species and the circles define the leading and trailing edge of each distribution. For the Whinchat, the relative position of the reference points between the two distributions indicates a decline in density but no significant shift in latitude or altitude (marginal change). For the Stonechat, densities imply a general increase, especially at higher latitudes and higher altitudes, where the altitudinal optimum has shifted to a much higher elevation.