Figures & data
Figure 1. Number of records per year in the Swiss ID data base of opportunistic observations contributed by enrolled volunteers during 1991–2012.
Figure 2. Comparison of annual indices and linear regressions fitted to them for November and January waterbird census counts and raw SOPM indices, as well as the two variants of SOPM indices that were standardized by resampling (variant 1: resample records, variant 2: resample visits) for six example species (left column: A category species, right column: B or C category species; see text). Observed counts or SOPM indices and trend lines are shown for waterbird census data (black filled circles, solid line), raw SOPM index (open circles, dashed line) and standardized SOPM indices (variant 1: blue, variant 2: red). Error bars in standardized SOPM indices represent 1 se. For plots of all species, see the supplementary online materials).
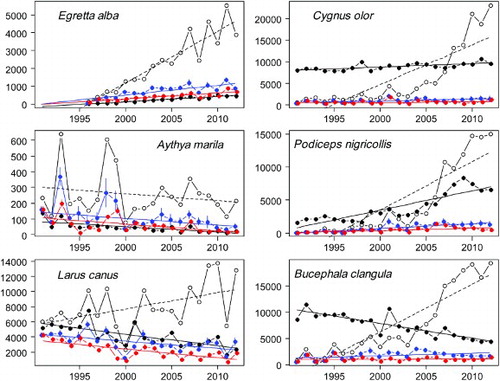
Figure 3. Scatterplots of the absolute trend estimates (log-transformed) for 56 wintering wetland species in Switzerland based on five data sets/analyses: trends for waterbird census data on the x axis and on the y axis trends based on unstandardized (raw) SOPM indices (3a), standardized indices of variant 1 (resampled records; 3b), standardized indices of variant 2 (resampled visits; 3c) and the average of the two standardized indices (3d). Horizontal grey lines show the values for no trends (i.e. 0) and the diagonal grey line shows equality between two sets of trend estimates.
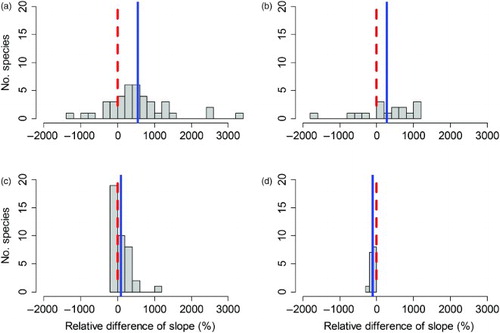
Figure 4. Comparison of relative differences (in per cent of the waterbird census-based trend) of SOPM-based trends computed from opportunistic ID data. (a) Raw SOPM index; (b) standardized SOPM index (variant 1: resampled records); (c) standardized SOPM index (variant 2: resampled visits) and (d) mean of the two standardized SOPM indices. The dashed red line indicates a value of zero, which corresponds to perfect agreement of the trends. The blue line shows the average relative difference.
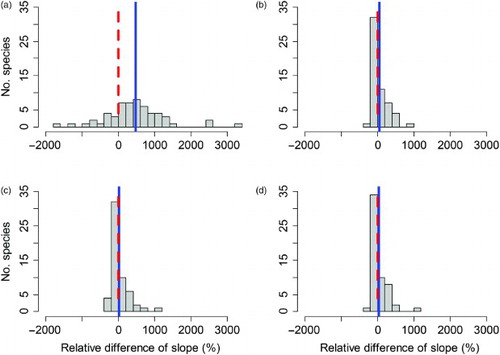
Figure 5. Comparison of relative differences (in per cent of the waterbird census-based trend) of SOPM-based trends computed from opportunistic ID data separated for the 40 type A and 16 type B or C species; see text for explanation. (a) Raw SOPM index for species A; (b) raw SOPM index for species type B and C; (c) standardized SOPM index for species A and (d) standardized SOPM index for species type B and C. The dashed red line indicates a value of zero, which corresponds to perfect agreement of the trends. The blue line shows the average relative difference.