Figures & data
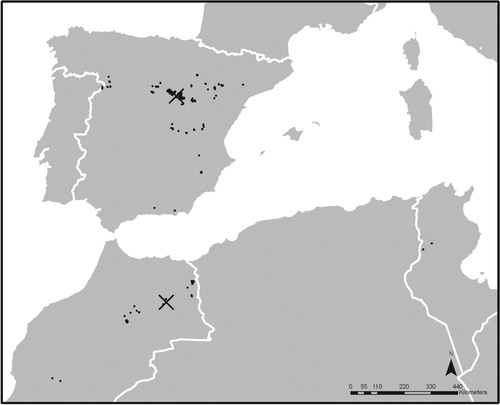
Figure 1. Geographic origins of Dupont’s Lark samples in Spain, Morocco and Tunisia during the period 1986–2013. Black dots indicate capture sites, black crosses mark Spanish and Moroccan population centroids based on geographic coordinates of capture points. For a global distribution map of the species, see de Juana and Suárez (Citation2016). For a more detailed distribution in Spain see Suárez (Citation2010) and, in Morocco, García et al. (Citation2008b).