Figures & data
Figure 1. Invertebrate composition (by percentage of equivalent fresh weight) of Chough faecal samples, using the same invertebrate groups for samples collected from: (A) mixed pasture habitats in 1988 and 2011–13 and dune pasture habitats 2011–13; and from (B) dune pasture habitats in 2011–13.
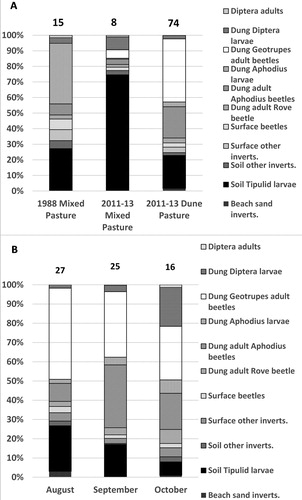
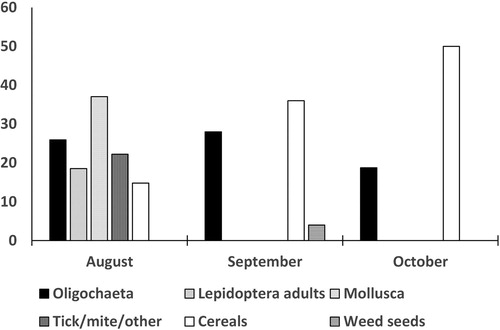
Figure 2. The percentage frequency of presence of prey groups in Chough faeces in 2011–13. These prey groups were identifiable but only detectable in small parts and not able to be reconstructed into definite numbers of individuals. The number of samples in each month were 27 in August, 25 in September and 16 in October.