Figures & data
Table 1. Grid references for the Barn Swallow colonies under investigation, the number of breeding pairs known to be present at each site and the number of grass and enhanced margins surveyed on each site.
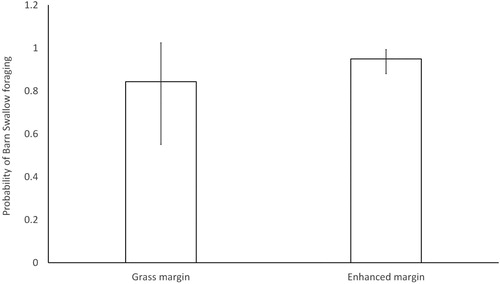
Figure 1. Estimated probability of observing a foraging Barn Swallow during surveys. Probabilities and standard errors were back transformed from the generalized linear mixed effects model estimates and account for the other variables modelled.