Figures & data
Figure 1. Location in northeast Spain of the three Dupont’s Lark populations surveyed during the breeding period of 2017.
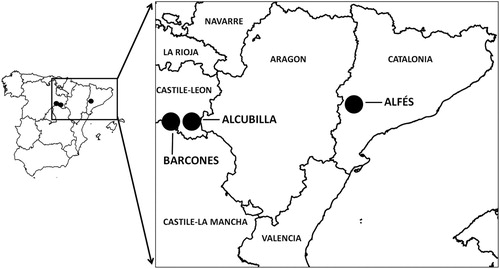
Figure 2. Sonogram of a typical Dupont’s Lark song. Rectangle shows the final song of the species, which was used for building the recognizer.
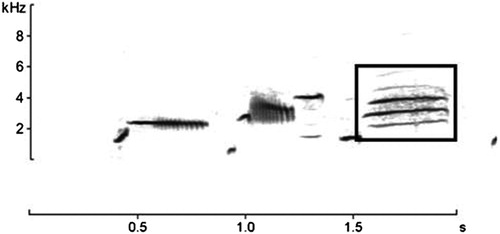
Figure 3. Estimates of the probability of detecting the presence of the Dupont’s Lark under four density scenarios in a 100 ha patch, given a different number of autonomous recording units (ARUs) deployed. Estimates were obtained through logistic regression using presence/absence as a dependent variable and the number of ARUs as a predictor variable. Grey points show the estimates (presence/absence) derived from 1000 randomizations using different random locations per individuals and regular locations for ARUs. The dotted line marks 90% probability to detect the species.
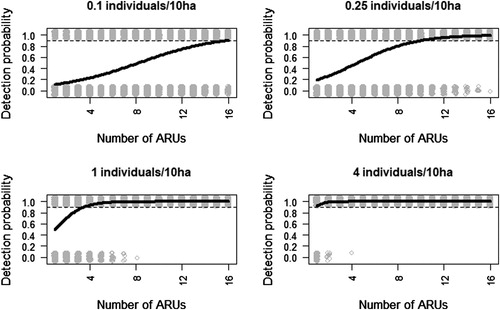
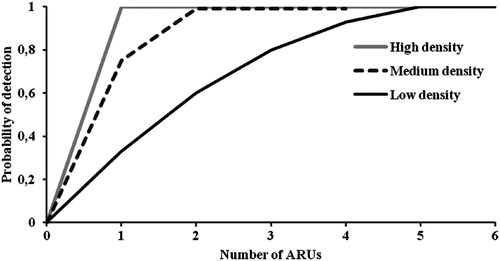
Figure 4. The probability of detection of Dupont’s Lark as a function of the number of autonomous recording units (ARUs) deployed in three populations surveyed during the 2017 breeding period in Spain. Populations had different densities and curves were built for each density scenario separately. In the population of medium density only four ARUs were used and thus the curve is shorter.