Figures & data
Figure 1. Survey area (marked as a polygon), with Mersey Gateway bridge location shown, between Runcorn and Widnes in northwest England.
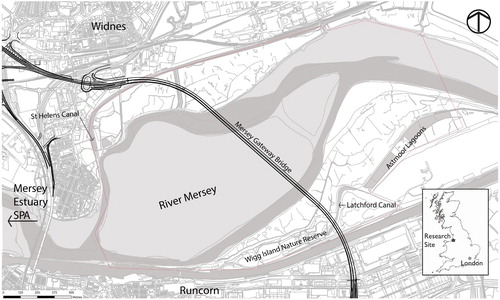
Table 1. Recorded wintering water-bird species and their groups used in the analyses. Values in brackets are the mean counts and the range across all survey years. The variation in the counts of different species within each group was considerable (e.g. a peak of one Avocet Recurvirostra avosetta and a peak of 1703 Lapwing Vanellus vanellus, with a mean of 232, in the Wader group) and therefore it is appreciated that some of the more commonly recorded species will have a greater influence on the results of the analyses. However, by grouping together it meant that all species could be considered, whilst ensuring that the quality of the dataset was not undermined by an excess number of zero counts.
Table 2. Territory number of all breeding bird species before and during bridge construction works, along with the change (%) in number during versus before the works, and the results of the Mann Whitney–Wilcoxon test which tested whether territory number of each of the five bird groups (and all species combined) differed before and during the works. The values in bold signify that the species territory number was lower during the bridge construction works, compared to before the works.
Figure 2. Box and whisker plots of breeding bird territory number for each survey year, for the bird groups. ‘Other passerine species’ are termed ‘Passerine Species’ in the plots. The three horizontal lines in the boxes represent the 25% quartile, the median and the 75% quartile; in some cases one or more of these values are identical and thus fewer than three lines are shown. The whiskers represent minimum and maximum values and are only presented when they differ from the 25% and 75% quartiles respectively.
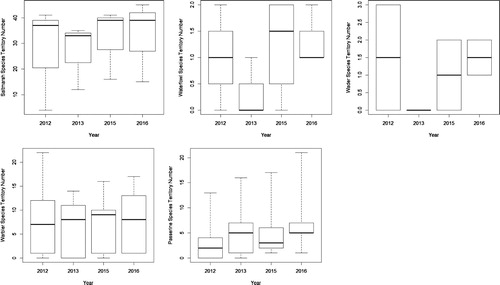
Table 3. Generalized linear models of wintering water-bird abundance and species richness as a function of time of bridge construction (‘before construction’ and ‘during construction’) and stage of winter period (‘early winter’ and ‘late winter’). For the explanatory variable, time of bridge construction, during construction is set at 0 (the intercept) and for stage of winter period, early winter is set at 0 (the intercept).
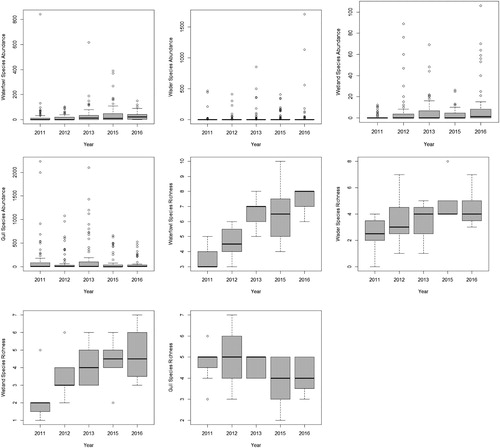
Figure 3. Box and whisker plots showing wintering water-bird abundance and species richness for each survey year, for the four bird groups. The three horizontal lines in the boxes represent the 25% quartile, the median and the 75% quartile; in some cases one or more of these values are identical and thus fewer than three lines are shown. The whiskers represent minimum and maximum values and are only presented when they differ from the 25% and 75% quartiles respectively.