Figures & data
Figure 1. Map of the Bay of Biscay showing the area where the coastal counts were performed in the southeastern the Bay of Biscay.
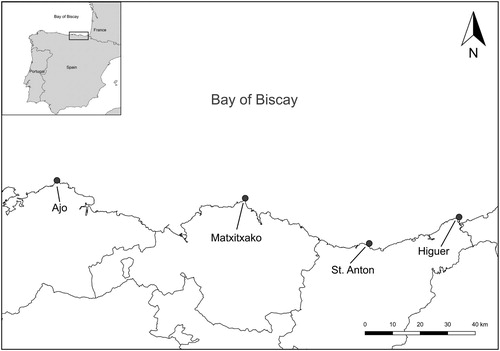
Table 1. Mean (±se), range and total number of Gannets counted by hour and sampling day during the 3-hour survey period at each sampling cape and period (wintering, pre-breeding, breeding and post-breeding) within the Bay of Biscay, for the period 2006–15. The number of sampling hours is shown in parenthesis.
Table 2. Beta-parameter estimates (±se, P values) obtained from the best model used to predict coastal Gannet counts in the southeastern Bay of Biscay. Only significant parameter estimates are shown.
Figure 2. Mean (±se) number of Gannets counted by cape and four phenological periods. Grey bars represent the global mean number of counted Gannets for all four capes.
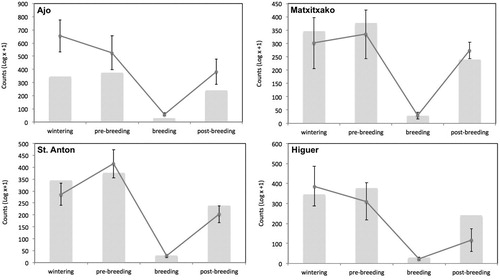
Figure 3. Gannet counts in the capes in relation to northwest-wind component values. Data from the four study capes have been pooled due to the lack of a significant cape × wind interaction ().
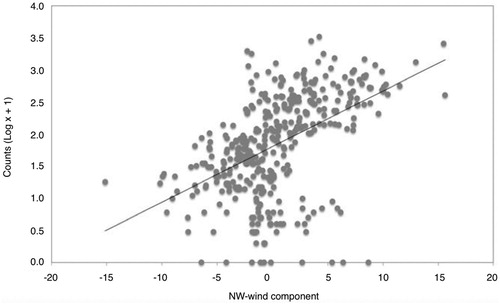
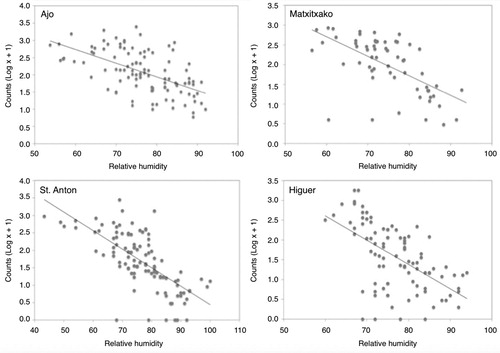
Figure 4. Relationship between relative humidity and Gannet counts at the capes. Relative humidity values were calculated for each count value (log x + 1) for each cape separately. The four capes are represented individually since there were differences in the relative humidity effect between the capes (P < 0.05).