Figures & data
Figure 1. Map of seabird mark-recapture studies conducted annually in the UK as part of the Seabird Monitoring Program Key Sites (triangles), and as part of a national citizen-science program implemented by the British Trust for Ornithology (cross-hairs) (Projection: British National Grid).
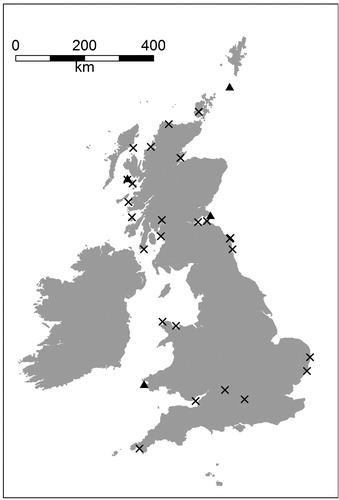
Figure 2. The statistical power of different mark-recapture survey designs to resolve true adult survival rates. (A–C) scenarios with only adults marked and released each year and (D–F) scenarios with both adults and chicks marked and released each year. Light grey polygon represents field conditions that achieved 95% of survival estimates within 2% of the true mean. Dark grey polygon demarked by black points represents field conditions that resulted in 95% of survival estimates within 1% of the true mean.
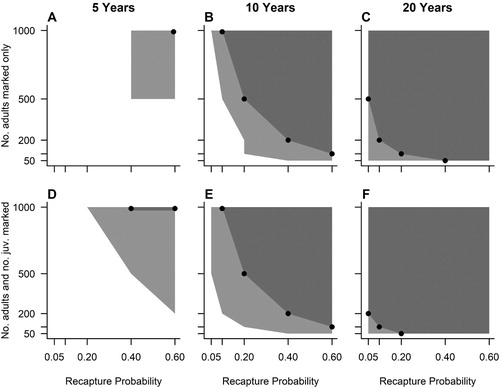
Figure 3. The statistical power of different mark-recapture survey designs to resolve true juvenile survival rates. Light grey polygon represents field conditions that achieved 95% of survival estimates within 2% of the true mean. Dark grey polygon demarked by black points represents field conditions that resulted in 95% of survival estimates within 1% of the true mean.
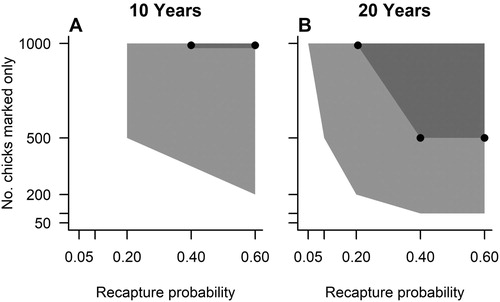
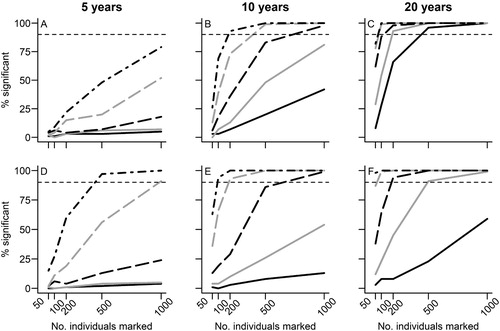
Figure 4. The certainty of detecting temporal (A–C) variation in survival rates and individual heterogeneity associated with transience (D–F) based on different scenarios of field effort: (A and D) 5-year time series; (B and E) 10-year time series; and (C and F) 20-year time series. Recapture scenarios as follows: black solid line = 0.05, grey solid line = 0.1, black dashed line = 0.2, grey dashed line = 0.4, black dot-dash line = 0.6. Figure shows results from the likelihood ratio test and the horizontal dotted line indicates the 90% threshold for certainty.