Figures & data
Table 1. Area of woodland patches surveyed for Marsh Tits using playback over the specified number of springs (surveyed years) during 2009–18. Also given are the maximum number of occupied territories estimated from surveys, the number of surveyed years when a percentage of the population was colour-marked, and the mean percentage and minimum–maximum percentage range of the population that was marked in years when such birds were present.
Table 2. Cormack–Jolly–Seber modelling output for two candidate models estimating annual survival (Φ) and detection probability (p) of Marsh Tits over nine annual intervals, where parameters were time-dependent (t) annually, or fixed at a value of 0.99.
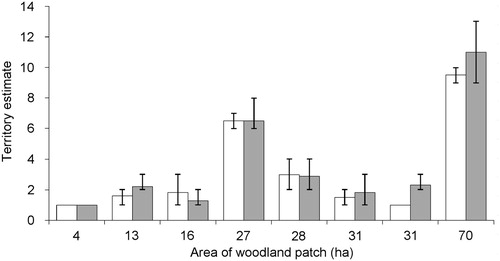
Figure 1. Mean (columns) and minimum–maximum (errors bars) of the estimated number of Marsh Tit territories derived from playback surveys in woodland patches of a given area. White columns represent years when less than 20% of the population was unmarked and grey columns are years when at least 20% of birds were colour-marked.