Figures & data
Figure 1. Study region (in grey) where spatial variation of changes in Herring Gull colony sizes were assessed between the first survey in 1969 and the most recent survey from 1998 to 2002. The study region spans two regional seas: Minches and West Scotland in the north and Irish Sea in the south (JNCC Citation2014). Also indicated are the four ICES sea areas (45, 46, 47 and 50) used to estimate availability of fishery discards.
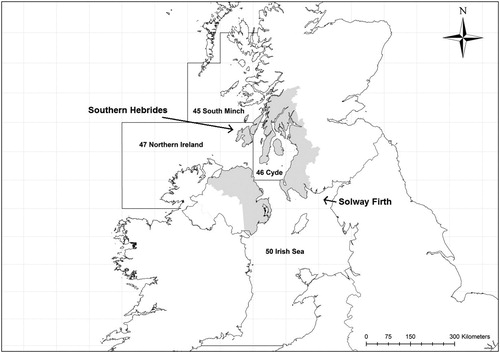
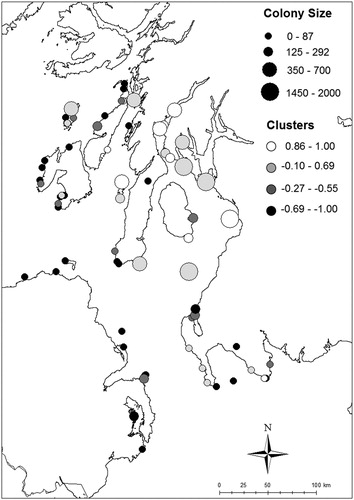
Figure 2. Locations of Herring Gull colonies with known changes in colony size between 1969 and 2002 across the study region. The shade of the circle depicts the extent of colony growth rate over the study period; along a gradient of white (strongest increase) to black (strongest decline); categories based on a K-means cluster analysis (see text). The size of the circle reflects the size of the colony at the end of the census period during Seabird 2000 (1998–2002).