Figures & data
Table 1. Distribution of Chough known historic breeding locations across UK and Isle of Man and survey coverage achieved in each region.
Table 2. UK and Isle of Man population estimates and regional estimates (number of breeding pairs) from two standard visits and using all additional information. Breeding pairs were classified as possible (poss), probablr (prob) or confirmed (conf) base don the criteria given in Appendix. The discrepancy (%) between these estimates is included to show the influence of additional information on estimates (>2 standard surveys & colour ring records). The percentage of the UK and Isle of Man population in each area (based on confirmed and probable totals using all additional information) and the number of non-breeding birds are also shown.
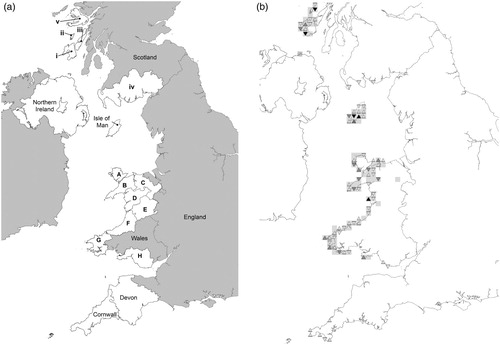
Figure 1. (a) Geographical areas referred to in the text in relation to the current and historic distribution of Choughs in the UK and Isle of Man (Wales areas A–H: A. Anglesey, B. Caernarfon, C. Denbighshire, D. Meirionnydd, E. Montgomery, F. Ceredigion, G. Pembrokeshire, H. Glamorgan. Scotland areas i–iv: i. Islay, ii. Colonsay, iii. Jura, iv. Dumfries & Galloway, v. Mull). (b) Distribution of Chough breeding pairs in 2014. Grey 10-km squares show areas of continued occupancy in 2002 and 2014. Range loss and expansion indicated by downward and upward pointing triangles, triangles overlaid squares show net increase and decrease in number of pairs within occupied squares (light grey = 1–2pairs, mid grey = 3–5 pairs, dark grey = 6–8 pairs).