Figures & data
Figure 1. Map showing the location of the study area and positions of grid cells sampled in 2016 (black squares) and 2017 (white squares).
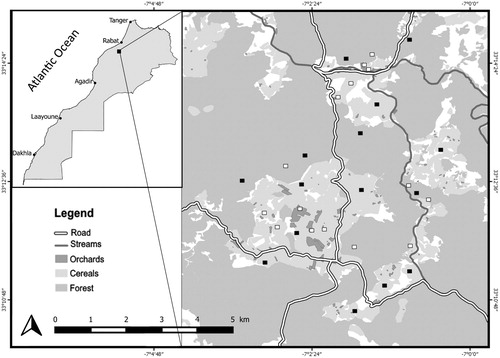
Table 1. Description of habitat variables measured around survey points (nest-site and random points) within two spatial levels (local- and landscape scales) and used in the analyses of Barbary Partridge nest habitat selection model.
Table 2. Descriptive statistics for variables (mean ± se) measured at Barbary Partridge nests and random points using t tests. Wilks lambda = 0.580; F = 4.759; P < 0.001 (Multivariate analysis of variance).
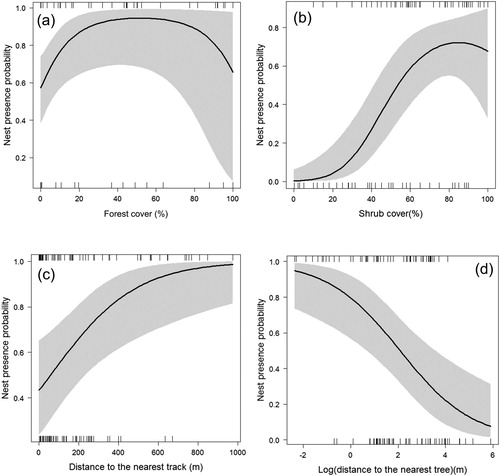
Figure 2. Probability of presence of Barbary Partridge nests according to: (a) forest cover, (b) shrub cover, (c) distance to the nearest track and (d) to nearest tree, in an agroforestry system of Central Morocco. The shaded grey areas are the lower and upper 95% confidence limits.