Figures & data
Figure 1. Distribution of transects in the study area; lines indicate clustering of more than one transect along the wadis, see text for details.
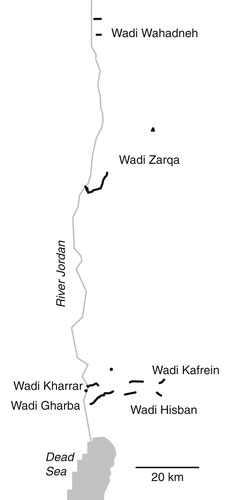
Table 1. Variables used in the models with range, mean and standard deviation of the observed values in n = 58 transects.
Figure 2. Path analysis used for the Dead Sea Sparrow occurrence probability, with estimated slopes for the simple linear regressions of P. juliflora and mean shrub height (MHS) on grazing, and with estimated partial effects of a logistic regression (with logit-link) predicting Dead Sea Sparrow occurrence from the other four variables. Numeric variables centred and scaled. Values are point estimates and 95% intervals in brackets.
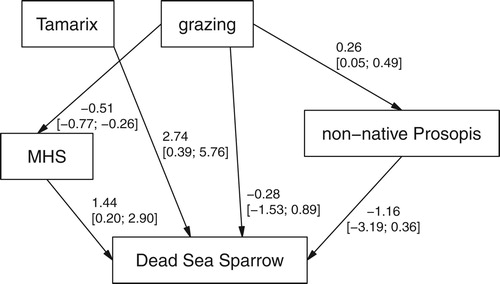
Figure 3. Path analysis used for the Clamorous Reed Warbler occurrence probability, with estimated slopes for the simple linear regressions of P. juliflora, mean shrub height (MHS) and reed on grazing, and with estimated partial effects of a logistic regression (with logit-link) predicting Clamorous Reed Warbler occurrence from the other five variables. Numeric variables centred and scaled. Values are point estimates and 95% intervals in brackets.
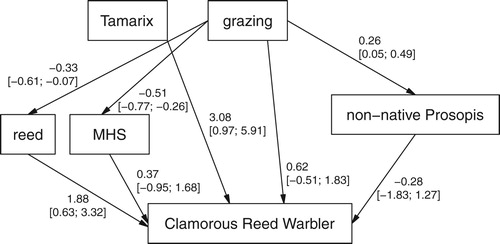
Figure 4. Observed correlation between grazing and Tamarix density (small grey dots, jittered to prevent overlap). Mean Tamarix values per grazing score are given as larger black dots connected with a line.
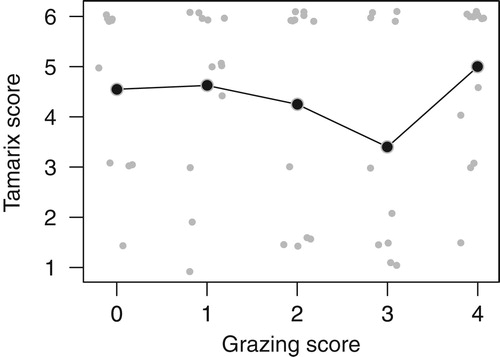
Figure 5. Total, direct and indirect effects of grazing on Dead Sea Sparrow occurrence probability from the path analysis (). For the graph, the Tamarix density value was set to 5.5 since Dead Sea Sparrows appear to be very scarce at Tamarix values below 5. See text for effect sizes and uncertainties.
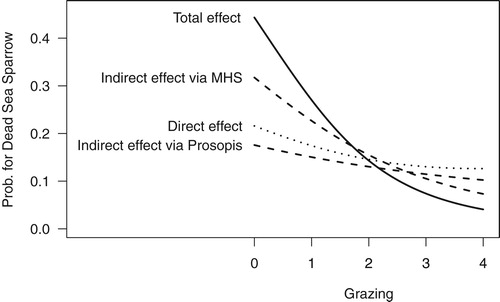
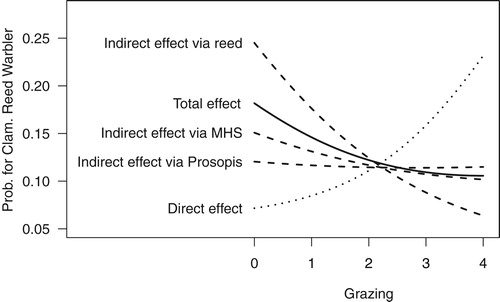
Figure 6. Total, direct and indirect effects of grazing on Clamorous Reed Warbler occurrence probability from the path analysis (). For the graph, the Tamarix value was set to 5.5 since Clamorous Reed Warbler appear to be scarce at Tamarix values below 5. See text for effect sizes and uncertainties.