Figures & data
Figure 1. 50 × 50 km squares for which data were reported for EBBA1 (light grey squares) and for EBBA2 (dark grey dots). EBBA1 data came from 3949 squares and coverage for EBBA2 was 5095 squares (provisional values yet). These values correspond, respectively, to 74% and 96% of the total number of squares in the area shown in the map. It is very important to highlight that the completeness of the coverage was very low in EBBA1 in the northern half of Russia and in some parts of Caucasus and the Western Balkans. Data collection for EBBA2 was mainly carried out from 2013 to 2017 in the more than 50 participating countries, including much better coverage in the European parts of Russia and Kazakhstan, the Caucasus countries, the Canary Islands, Cyprus and the whole of Turkey.
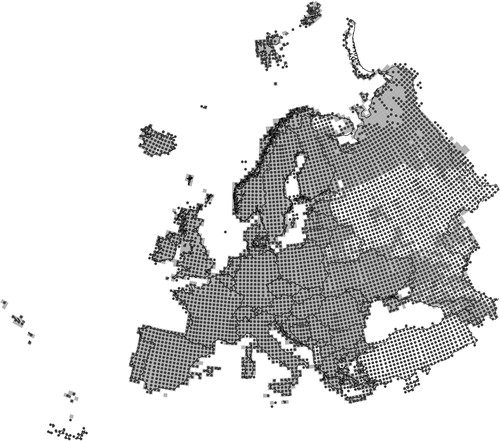
Figure 2. Number of papers citing EBBA1 that were attributed to each of the analysed main topics.
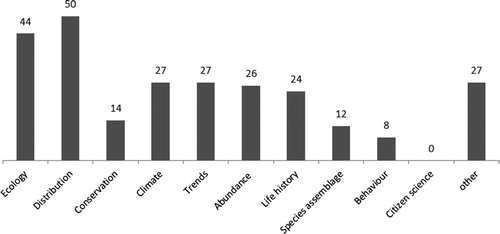
Figure 3. Location of the 17 000 10 × 10 km squares with EBBA2 standardized surveys. In the context of this project, all these squares were surveyed in a standardized manner between one and ten times. Each survey have a complete list of all species recorded in a given time frame at a particular site and on a single day.
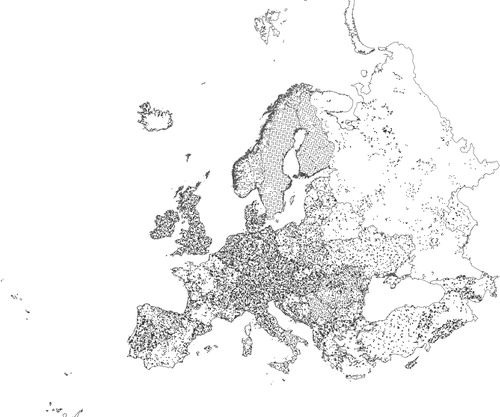
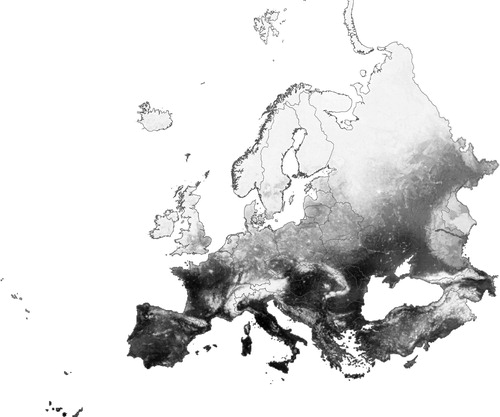
Figure 4. Pilot map showing the probability of occurrence for the Turtle Dove Streptopelia turtur in all 10 × 10 km squares in Europe based on EBBA2 spatial distribution modelling (light-dark grey indicates low-high probability of occurrence, respectively).