Figures & data
Table 1. Comparison of migratory parameters between one juvenile and 26 adults of Cory’s Shearwaters from Gran Canaria, Canary Islands, Spain. Departure from the colony is only estimated for the juvenile as it relies on light data, which was not available for adults because, excluding incubation, they only attend burrows during night-time.
Figure 1. Spatial distribution of one juvenile (a) and adult bird (b) of Cory’s Shearwaters from Gran Canaria, Canary Islands, Spain, tracked with geolocators throughout the annual cycle. (a) Track of the juvenile from its natal colony to the beach where it was found dead (Florida, USA: 29°12′11″N 80°59′42″W). The bird fledged on 30 October 2017, and beached on 06 July 2018. (b) Schematic annual phenology and distribution of 33 adult Cory’s Shearwaters. Main phenological events are plotted clockwise in the upper circle: breeding period in dark red, outward migration in light green, wintering period in dark green, and return migration in pink. Coloured areas are minimum convex polygons of bird positions during the breeding and wintering periods (in dark red and dark green, respectively). The main wintering areas were associated with Benguela and Agulhas Currents (n = 22 individuals), Brazil-Malvinas confluence region (n = 2), and Canary Current (n = 7). Additionally, outward individual trajectories of the migratory adult birds (modelled using positions 6 days after leaving the breeding area) are plotted as green lines. Exclusive Economic Zones (EEZs) are also shown in white dashed lines and sampled colony is depicted with a yellow star on both figures.
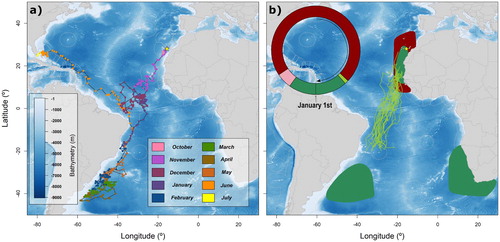
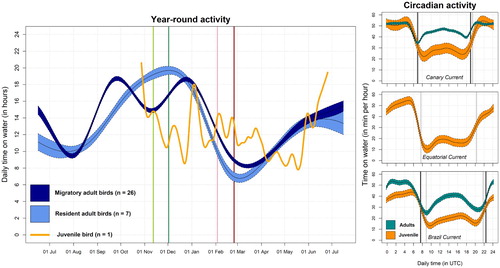
Figure 2. Daily resting time year-round (left-hand panel) and circadian activity (right-hand panels) of one juvenile and 33 adult Cory’s Shearwaters. Estimates of daily time on the water are plotted separately for each migratory strategy of adults (resident in light blue and migratory in dark blue), and for the juvenile bird (orange). For the curves of adult daily activity budgets, the solid lines correspond to the mean for each treatment group estimated using GAMMs and the coloured regions around the means show the associated 95% confidence intervals. The juvenile activity is represented by a smoothed curve. As references, coloured lines corresponding to average dates of the main phenological events estimated for those migratory adult birds are also plotted in the background: onset of the outward migration (light green), start of the wintering period (dark green), onset of the return migration (pink), and staging in the breeding ground (dark red). Circadian resting activity of the juvenile shearwater (in orange) in the three specific areas used by the bird: the Canary Current (25 days), the Equatorial Atlantic Current (59 days), and the Brazil Current (182 days). Circadian activity is also modelled using GAMMs and shown as time spent on the water. For reference, we plotted (when available) adult activity in those respective areas (in blue). Note that juvenile and adult activity do not represent the same periods of the annual cycle. Vertical lines correspond to mean of daily sunrise and sunset timings of each dataset (in light and dark grey for the juvenile and adults, respectively).