Figures & data
Figure 1. The study area, the district of Rotenburg (Wümme) (grey area in the overview map above left), is located in Lower Saxony (hatched area), Germany. The study sites are located in the vicinity of Zeven (data basis: GeoBasis-DE/BKG Citation2017; MU Nds. Citation2018).
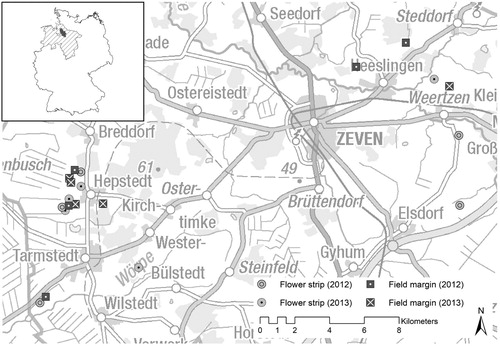
Table 1. Sampling design in the different seasons of the years 2012–2014. V: total number of visits (line transects); Cd: total number of camera-days (camera trapping); n: number of study sites (flower strips and field margins); Winter 2012/13 no surveys on field margins by line transects.
Figure 2. Diagram of the research design (C1–C5: 5 camera locations).
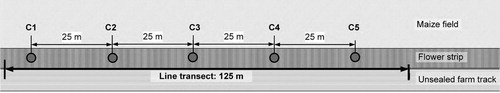
Table 2. Overview of the response variables (resp), explanatory variables (expl) and random effects (ran).
Table 3. Comparison of the two survey methods with regard to species range and species numbers. CT: Camera trapping, LT: Line transect, asmall-sized songbirds, bgalliformes, grey highlights: species recorded by both survey methods (CT and LT).
Figure 3. Number of species in relation to research effort. Broken line represents 100% of the overall number of detected species (by both methods) for each habitat type (FM = Field margins, FS = Flower strips). Camera trapping: Each camera day of one of the five study sites of each habitat type was calculated as an individual camera-day. Line transects: Each visit of one of the five study sites of each habitat type was calculated as an individual visit.
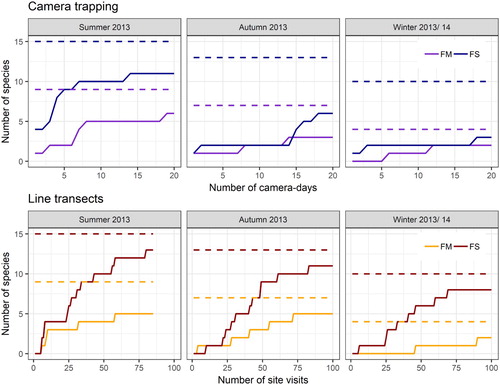
Table 4. Pairwise comparison of the mean number of species between the habitat types and/or the applied method and/or the season for (a) both habitat types (lsmeans to lme2 fitted by REML, selected contrasts) (b) flower strips (lsmeans to mod6 fitted by REML) and (c) field margins (lsmeans to mod8 fitted by REML). As the season had no significant effect on number of species in flower strips (b), no seasonally specific analyses were carried out for this habitat type. Results are given on the log (not the response) scale; only Confidence-Intervals (CI) are back-transformed from the log scale. FS: Flower strips; FM: Field margins; CT: Camera trapping; LT: Line transects; MC: Method combination.
Figure 4. Presence time of birds in front of a camera. The calculation is based on the time-triggered interval of 20 s. One picture with bird occurrences was counted as a presence time of 20 seconds. For a better representation of the short presence times the y-axis was power-transformed. FS = flower strips (galliformes: winter 2012/ 13: n = 8, summer 2013: n = 4, autumn 2013: n = 7, winter 2013/14: n = 12; small-sized songbirds; winter 2012/ 13: n = 0, summer 2013: n = 48, autumn 2013: n = 3, winter 2013/14: n = 2), FM = field margins (galliformes: all seasons n = 0; small-sized songbirds: winter 2012/13: n = 34, summer 2013: n = 59, autumn 2013: n = 13, winter 2013/ 14: n = 5), n = number of bird observations, ° = outliers (cases whose values are 1.5 to 3 times the height of the boxes), * = extreme outliers (cases whose values are more than three times the height of the boxes).
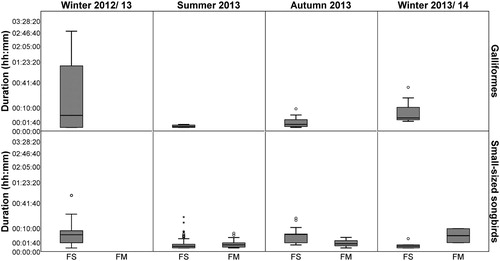
Figure 5. Number of detected bird occurrences as a function of the time interval of the camera trap trigger. Percentage of bird records were calculated per habitat type (flower strips n = 159, field margins n = 63).
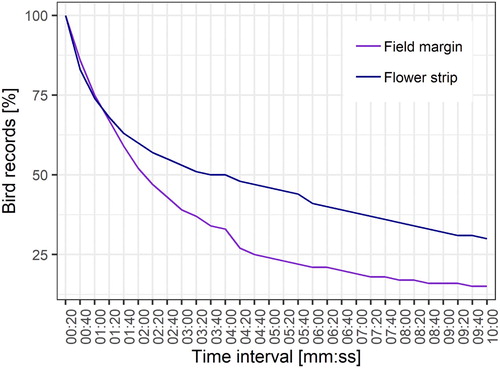
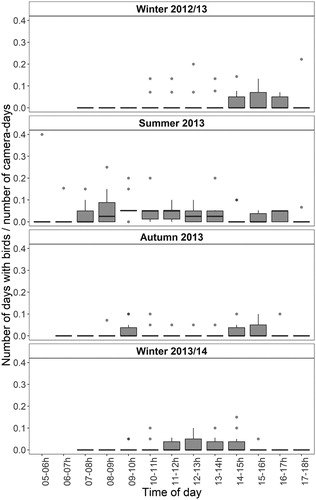
Figure 6. Temporal pattern of bird occurrence in different seasons of the year. Presented as percentage of the number of days with birds (days with birds present at the specific time of day) to the number of camera-days (days on which camera traps were operational in the field at the one-hour interval).