Figures & data
Table 1. Bird species richness and abundance for seasonal bird α-diversity by pond management type and seasonal γ-diversity of birds over all ponds.
Figure 1. Effect size plots for bird abundance over (a) breeding (b), post-breeding and (c) winter seasons. Taken from GLMM analysis, with se and upper and lower confidence intervals. Significance values as: P < 0.001 ***, P < 0.001 **, P < 0.05 *.
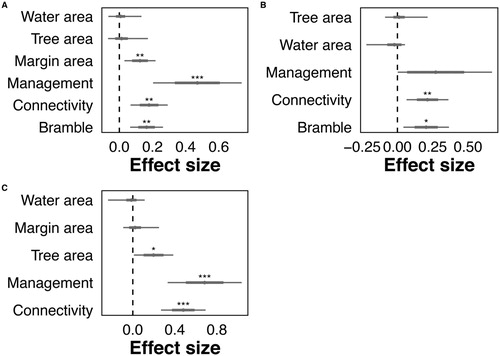
Table 2. Summary of the GLMMs explaining (a) breeding abundance and (b) species richness, in relation to pond features.
Table 3. Full average parameter estimates from the GLMMs for bird abundance, by season.
Figure 2. Effect size plots for bird species richness (a) over breeding (b), post-breeding and (b) winter seasons. Taken from GLMM analysis, with se and upper and lower confidence intervals. Significance value codes: P < 0.001 ***, P < 0.001 **, P < 0.05 *.
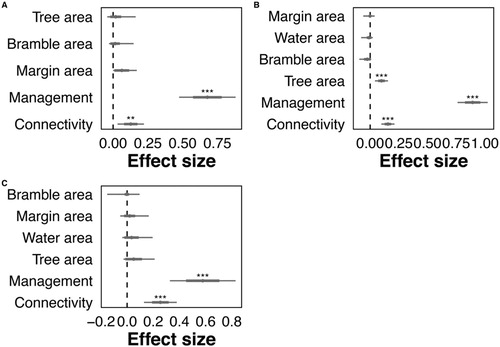
Table 4. Full average parameter estimates from the GLMMs for bird species richness, by season.
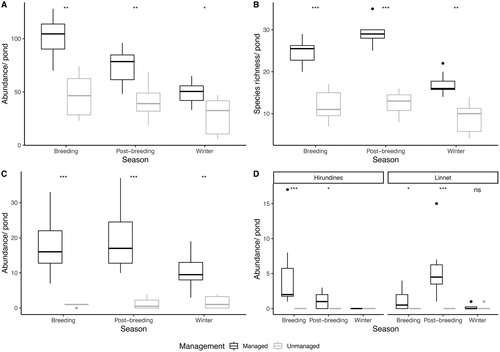
Figure 3. (a) Bird abundance by pond management and season, (b) bird species richness by pond management and season, (c) conservation priority (red and amber) bird abundance by pond management and season and (d) abundance of aerial insectivores by pond management and season. Boxplots show median, upper and lower quartiles, with data falling outside Q1–Q3 range plotted as outliers. Statistical significance of Mann–Whitney tests denoted by P < 0.001 ***, P < 0.01 **, P < 0.05 * and ns = not significant.