Figures & data
Figure 1. (a) Confirmed territory locations and (b) mean productivity (number of chicks fledged) of Hen Harriers in Ireland in 2010 and 2015, combined. Special Protection Areas (SPAs) are represented by grey polygons in (b).
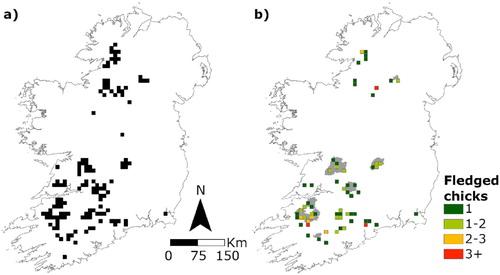
Table 1. Variables used in Hen Harrier territory site selection and breeding performance models. ‘Raw’ variables were not manipulated prior to analyses. Variables are listed according to the order in which they occur in the main text. CORINE class details are given in parentheses where appropriate. References are given to support the inclusion of each variable.
Figure 2. Relative importance of variables in explaining the locations of confirmed Hen Harrier territories relative to pseudoabsences at multiple spatial scales (1, 2 and 5 km, selected a priori), except for elevation which was extracted at each point location. D_ = distance to. Variables were ranked according to the sum of their Akaike weights within the top set of models (ΔAIC < 2). Black bars indicate variables that were present in the best approximating model; white bars indicate variables otherwise included in the top subset. Standardized coefficients ± se and P values are given to the right, where * = P < 0.05, ** = P < 0.001 and *** = P < 0.0001. The inset plot describes model accuracy as evaluated using randomly split 60:40 training:test datasets with 10-fold cross-validation.
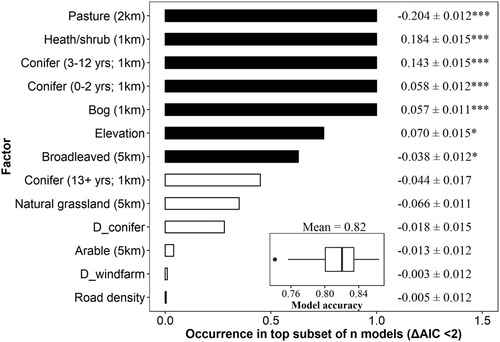
Figure 3. Euclidean distances (±1 sd) across five Principal Component scores for pairwise combinations Hen Harrier territory locations (t), upland pseudoabsences (pa1) and pseudoabsences distributed across the rest of Ireland (pa2).
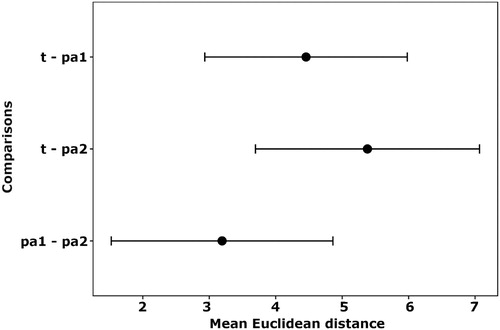
Figure 4. Relative importance of variables in explaining the breeding success of nesting Hen Harriers at multiple spatial scales (1, 2 and 5 km, selected a priori). Variables were ranked according to the sum of their Akaike weights within the top set of models (ΔAIC < 2). Black bars indicate variables that were present in the best approximating model; white bars indicate variables otherwise included in the top subset. Standardized coefficients ± se and P-values are given to the right, where * = P < 0.05, ** = P < 0.001 and *** = P < 0.0001. The inset plot describes model accuracy as evaluated using randomly split 60:40 training:test datasets with 10-fold cross-validation.
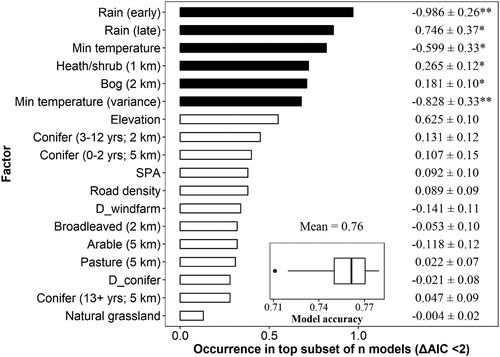
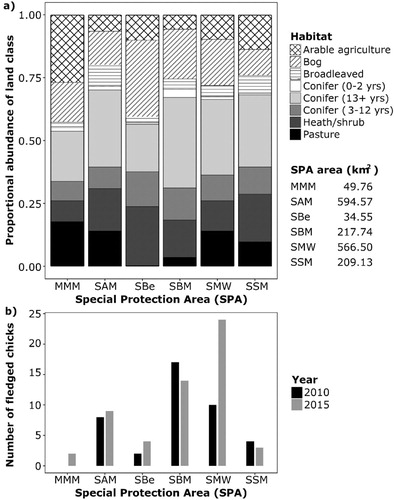
Figure 5. (a) Habitat composition of Special Protection Areas (SPAs) in Ireland that contained (b) successful Hen Harrier nests (produced at least 1 fledged chick) in 2010 and 2015. Natural grassland was omitted as it comprised a small fraction of available habitats across all SPAs. MMM = Mullaghanish to Musheramore Mountains; SAM = Slieve Aughty Mountains SPA; SBe = Slieve Beagh; SBM = Slieve Bloom Mountains; SMW = Stacks to Mullaghareirk Mountains, West Limerick Hills and Mount Eagle; SSM = Slievefelim to Silvermines Mountains. SPA areas were derived from the NPWS SPA shapefile 2017_06.