Figures & data
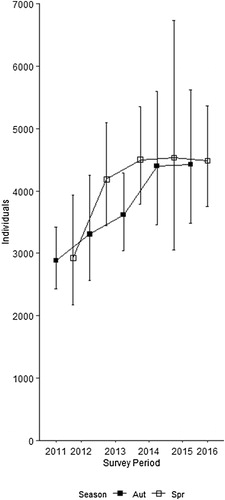
Figure 1. Study area in central southern England showing randomised locations of the Idealised Transect Routes (ITRs) for the first survey of Common Buzzards Buteo buteo in autumn 2011. Shading represents urban areas.
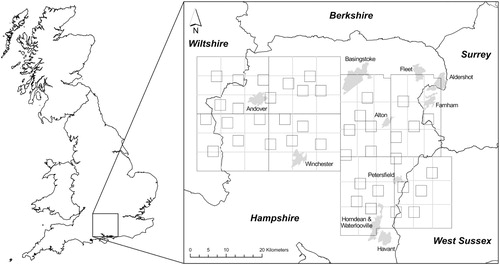
Table 1. Covariates used in modelling distance sampling estimates of Common Buzzards Buteo buteo in central southern England.
Table 2. Survey effort and numbers of observations made during surveys of Common Buzzards Buteo buteo in central southern England.
Table 3. Details of model selection statistics for distance sampling estimates of the Common Buzzard Buteo buteo population in central southern England. Preferred models are indicated by bold type. (Period – survey period number, season and year; Engine – analysis engine; Key – key function, U – Uniform, HN – Half normal, HZ – Hazard rate; Adjustment Term – series expansion type (number of terms), Cos – Cosine, HP – Hermite polynomial, SP – Simple polynomial; Covariates – included in the model; Parameters – total number of parameters in the model; ΔAIC – difference in Akaike Information Criterion between model with best fit and the current model; CvM(p) – cosine-weighted Cramér–von Mises Goodness of fit test value and (P value)).
Figure 2. Estimates of Common Buzzard Buteo buteo population size within the study area in central south England for each survey period between autumn 2011 and spring 2016 (± 95% confidence intervals).