Figures & data
Figure 1. FED of Lesser Spotted Woodpecker in Britain against year from 1949 to 2019 (1 = April 1st). Details of the relationships are given in the text. The dashed line shows the simple linear regression relationship of FED against year whilst the solid line shows the piecewise regression which provided a significantly better description of the data (F2 = 8.59, P < 0.001) with the break year of 1979 ± 3.5 (se).
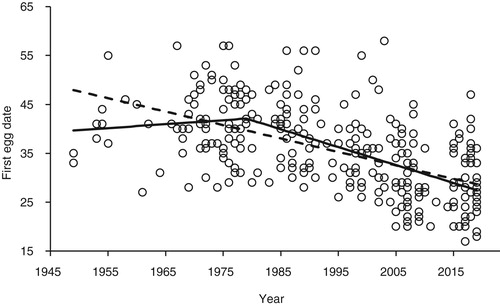
Table 1. A summary of the breeding parameters of Lesser Spotted Woodpeckers in each period with the significance of tests for the differences between periods. Period A – pre-1980, Period B – 1980–1999, Period C – 2000 onwards. Full details of the statistical tests are given in the text. For FED, clutch and young fledged the figures are given ± se but for the nest survival the figures give the 95% confidence range.
Figure 2. April Central England Temperature (AprCET) against year from 1949 to 2019. Details of the relationships are given in the text. The dashed line shows the simple linear regression relationship of AprCET against year whereas the solid line shows the piecewise regression which provided a significantly better description of the data (F 2 = 16.9, P < 0.001). The break year was 1978 ± 2.5 (se).
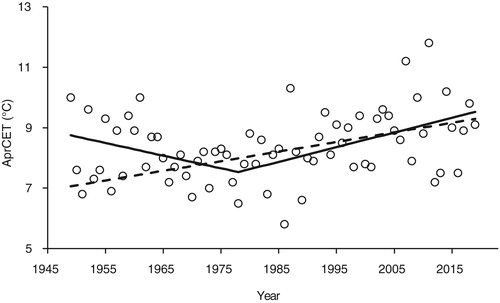
Figure 3. The relationship between the FED (1 = April 1st) of Lesser Spotted Woodpeckers and April Central England Temperature (AprCET). The regression was highly significant (F1 = 110.6, P < 0.001). Full details are given in the text.
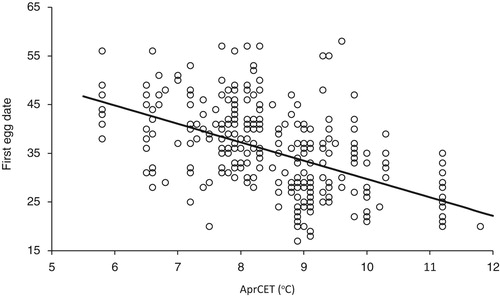
Figure 4. The trend in clutch size of Lesser Spotted Woodpeckers in Britain from 1949 to 2019 (n = 45). Some of the points have been plotted with ‘jitter’ to show multiple records with the same clutch size in any year. The trend with year was not significant – see text for details.
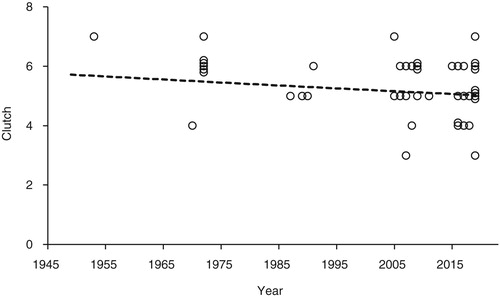
Figure 5. The numbers of young fledged from all nests (including failed nests) against year from 1949 to 2019 (n = 135). Some of the points have been plotted with ‘jitter’ to show multiple records with the same number of young fledged in any year. The regression was significant (F1 = 4.57, P = 0.03). Full details are given in the text.
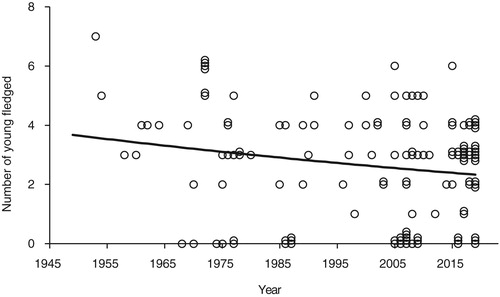
Figure 6. The clutch size plotted against EGGDIFF for Periods A & B and period C (○ = Periods A + B, n = 12; ● = Period C, n = 32). Some of the points have been plotted with ‘jitter’ to show multiple records with the same clutch size and EGGDIFF. The trend with EGGDIFF was not significant – see text for details.
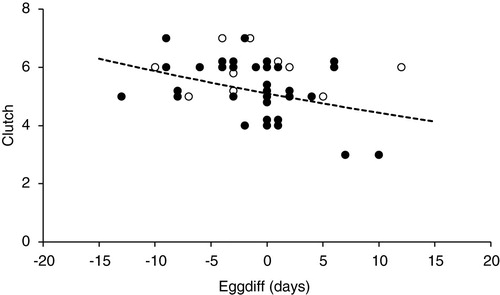
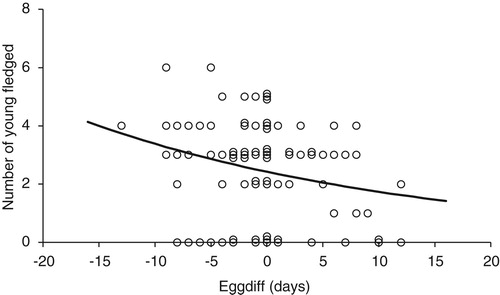
Figure 7. The numbers of young fledged from all nests (including failed nests) against EGGDIFF for Periods A & B (○ = Period A, n = 25; ● = Period B, n = 18). Some of the points have been plotted with ‘jitter’ to show multiple records with the same numbers of young fledged and EGGDIFF. The trend with EGGDIFF was not significant – see text for details.
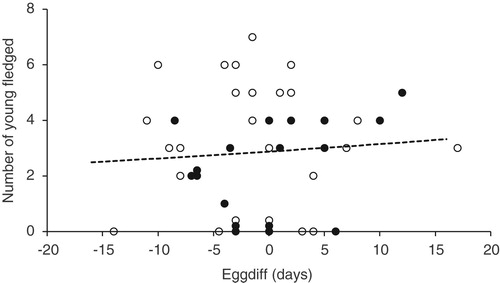
Figure 8. The numbers of young fledged from all nests (including failed nests) against EGGDIFF for Period C (n = 84). Some of the points have been plotted with ‘jitter’ to show multiple records with the same numbers of young fledged and EGGDIFF. The regression was significant (F1 = 5.41, P = 0.02). Full details are given in the text.