Figures & data
Figure 1. Routes on which recording of behavioural responses to the passing ferry was carried out. Route A: Houton – Lyness – Flotta; Route B: Kirkwall – Shapinsay; Route C: Tingwall – Rousay – Wyre – Egilsay.
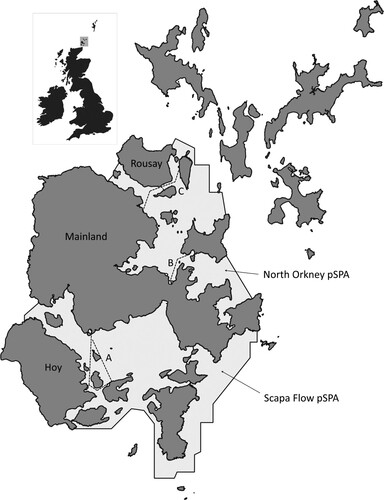
Figure 2. Summary of all responses by birds to a passing ferry. Number of records for each species is shown in parenthesis on the x-axis. Species are ordered from left to right in order of proportion of flocks responding.
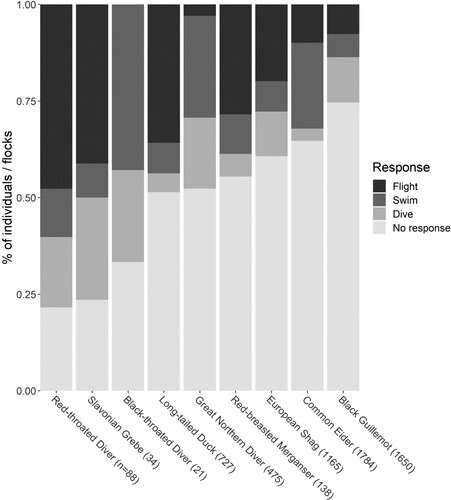
Table 1. Summary of species-specific response models. The ‘All responses’ models used flight, swim and dive responses in the response variable, while the ‘flight response’ modes only included flight responses. ‘Scapa Flow’ is the effect of data gathered in Scapa Flow compared to the reference level, North Orkney (see ). For Slavonian Grebe and Black-throated Diver all records were in Scapa Flow so there is no covariate shown. No Black-throated Diver flights were recorded so no flight model is shown. Statistically significant (P < 0.05) results are shown in bold. For the ordered categorical variables (sea state and distance band) the linear effect is shown, and quadratic effects are only shown where P < 0.05.
Figure 3. Predicted likelihoods of a) any response (flush, swim or dive) and b) flight responses to the passing vessel for each species at the four distance bands (with 95% confidence intervals) from the species-specific GLMs. Other covariates are held at mean values. There were no flight responses recorded for Black-throated Diver so no flight responses plot is shown for this species.
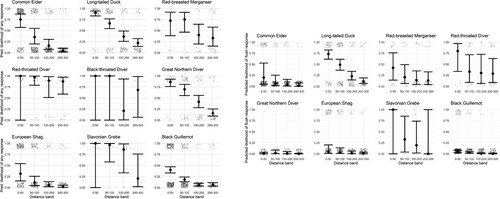
Table 2. Summary of the combined mixed effects models for all responses and flight responses. For the ordered categorical variables ‘distance band’ and ‘sea state’, only the linear and quadratic terms are shown. The fixed effects are the same as for the species-specific models (). The variance explained by the random effects ‘species’, ‘week’ and ‘trip’ (nested in ‘week’) and Marginal and Conditional R2 of each model are also shown. Statistically significant (P < 0.05) results are shown in bold.
Figure 4. Predicted likelihood of flocks flushing at different sea states with covariates held at mean values from the species-specific GLMs. Some sea state categories were combined where sample sizes were small.
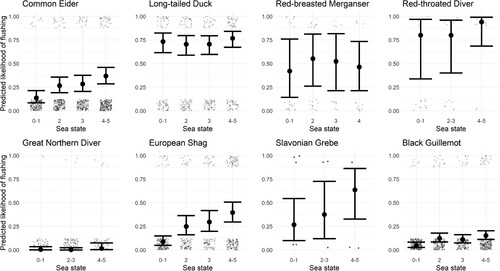
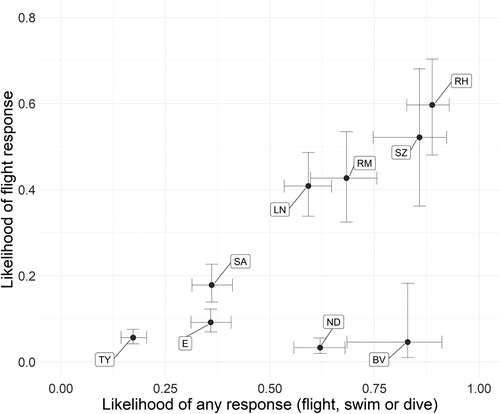
Figure 5. Likelihood of responses predicted from the combined GLMM models for each species, with the ‘any responses’ model predictions on the x-axis and the ‘flight responses’ model predictions on the y-axis. Predicted likelihoods are transformed into binary space where ‘1’ is certain to respond and ‘0’ certain not to respond. All other covariates are at mean values. E = Common Eider, LN = Long-tailed Duck, RM = Red-breasted Merganser, BV = Black-throated Diver, ND = Great Northern Diver, RH = Red-throated Diver, SA = European Shag, SZ = Slavonian Grebe, TY = Black Guillemot.