Figures & data
Table 1. Counts of individual Eiders during Shetland-wide moult flock population surveys in 1977–1993.
Figure 1. Map of Shetland showing the location of the 30 survey areas used for moulting Eider population surveys in 1996–2019 (see online Table S1 for additional details). Coastline and open water habitats were surveyed within the boundaries of each area (polygons or circles). Survey areas categorised as exposed coast are underlined (e.g. 1), those categorised as sheltered coast are not underlined (e.g. 2). Triangles indicate where counts significantly increased (pointing up) or decreased (pointing down) across years (1996–2019, P < 0.05; survey area 9 showed no significant trend). Fair Isle is situated 38 km southwest of the southernmost tip of Mainland Shetland. * indicates survey areas with no missing counts from 1996 to 2019.
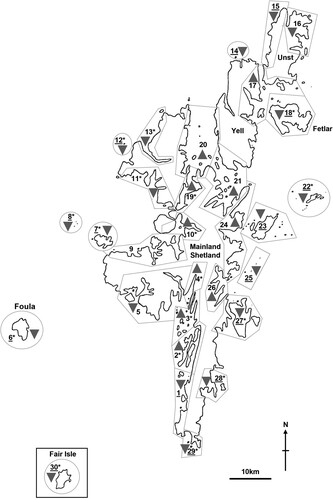
Table 2. Counts and estimated counts of Eiders during Shetland-wide population surveys at the time of moult (mid-July to mid-September), 1996–2019.
Figure 2. Eider counts from Shetland-wide population surveys at the time of moult (mid-July to mid-September), 1977–2019. Dotted lines = linear regressions of counts on year. Triangles = total counts from surveys in 1977–1993. Squares = estimated overall total counts from surveys in 1996–2019 (β = −136.2 individuals per year, z = −41.2, df = 9, P < 0.001). Circles = empirical total counts from surveys in 1996–2019, from the 17 survey areas with no missing counts (see methods; β = −138.2 individuals per year, z = −48.3, df = 9, P < 0.001). These data series are indices of population change from large-scale focused sampling of the Shetland coast.
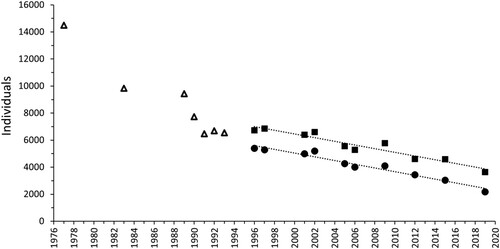
Figure 3. Eider counts at the time of moult (mid-July to mid-September) in areas categorised as exposed coast and sheltered coast, 1996–2019. Dotted lines = linear regressions of counts on year. Squares = estimated overall total counts (Exposed: β = −221.1 individuals per year, z = −92.7, df = 9, P < 0.001; Sheltered: β = 84.9 individuals per year, z = 35.9, df = 9, P < 0.001). Circles = empirical total counts, only including survey areas with no missing counts across years (Exposed: β = −204.3 individuals per year, z = −88.7, df = 9, P < 0.001; Sheltered: β = 66.2 individuals per year, z = 36.9, df = 9, P < 0.001).
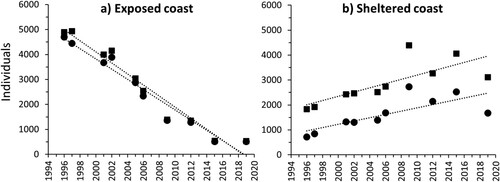
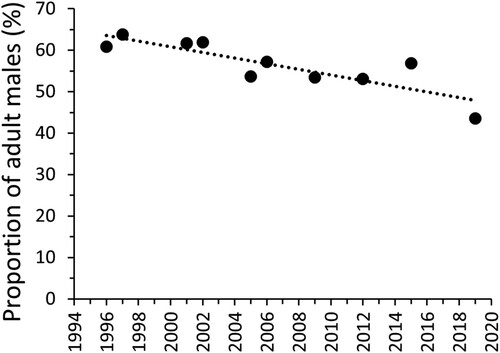
Figure 4. Proportion of Eiders that were adult male (%) among the sample of birds identified as adult male or female/juvenile during Shetland-wide moulting Eider population surveys in 1996–2019. Dotted line = linear regression of proportion of adult males on year (β = −1.24 per cent per year, t = −4.62, df = 9, P = 0.002). In each survey year, ≥ 86% of all Eider counted were categorised as either adult male or female/juvenile.