Figures & data
Figure 1. Multilayer perceptron with one hidden layer representation.
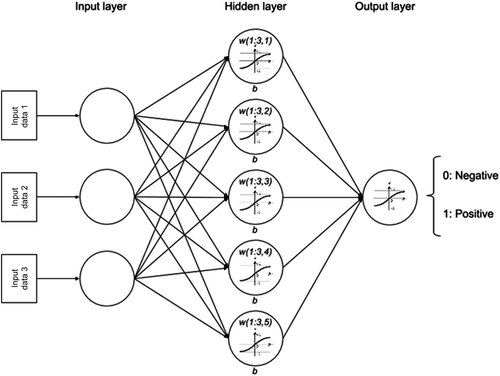
Figure 2. Egg production boxplot representing the daily average per bird for each of the 24 flocks analysed in this work.
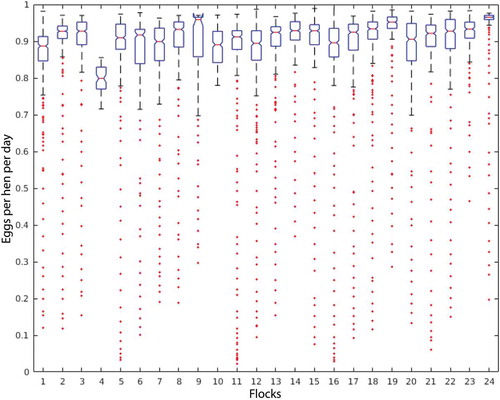
Figure 3. Daily production per bird in representative flocks number 8 and 23.
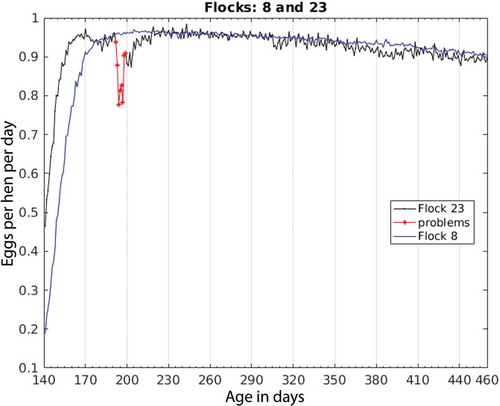
Figure 4. Grid search for window size and feature selection threshold: (a) accuracy, (b) specificity, (c) sensitivity and (d) positive predictive value.
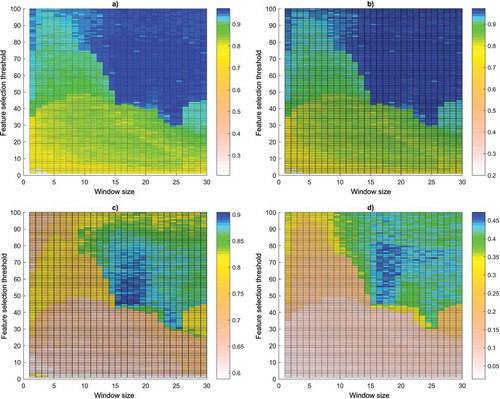
Figure 5. Selected features with a feature selection threshold of 65 in a window of size equal to 18 d.
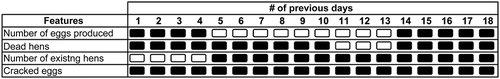
Table 1. Multiple comparisons of the evaluated architectures.
Figure 6. Performance chart of the model for different values of the parameter S.
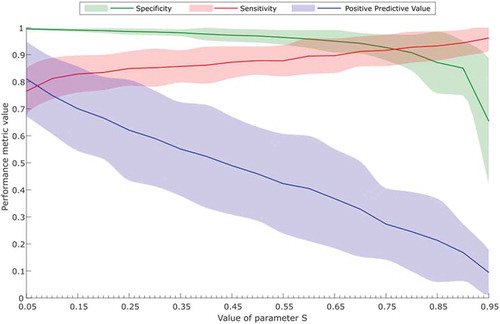
Table 2. Performance metrics for 5 prediction intervals.
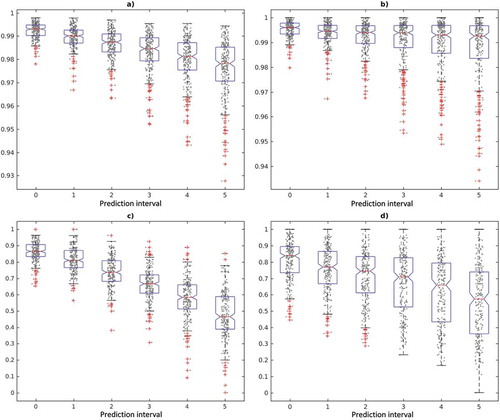
Figure 7. Boxplots of performance metrics for prediction intervals: (a) accuracy, (b) specificity, (c) sensitivity and (d) positive predictive value.