
Figures & data
Figure 1. Schematic (a) and pictorial (b) diagrams of the spectral acquisition system.
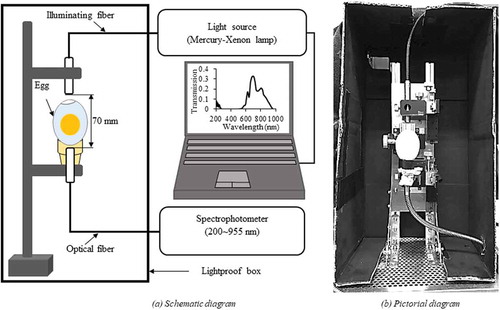
Figure 2. Feather sexing of male (a) and female (b) chicks.
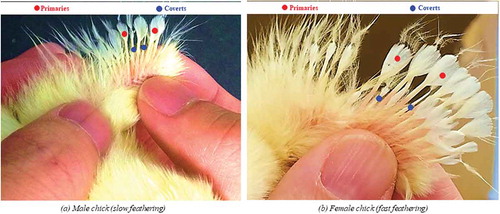
Figure 3. Mean transmission spectra of eggs at different incubation time in the visible region.
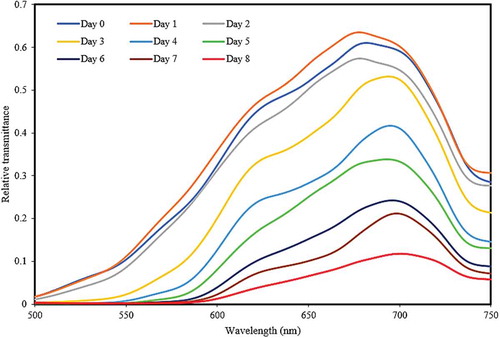
Figure 4. Microscopic view of embryo at day 1 (a) and day 2.5 (b).
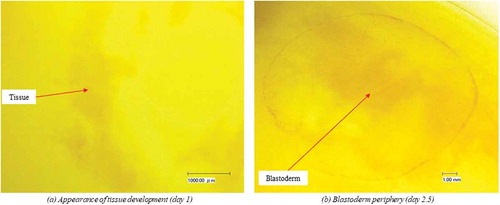
Figure 5. The change in the T575/T598 ratio during early incubation (points represent means, error bars represent standard error of means). Significantly different means within each group are indicated with a different letter (p < 0.01).
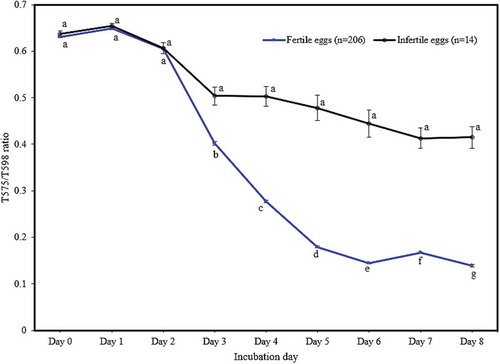
Figure 6. The change in the T575/T598 ratio for male and female eggs during early incubation (points represent means, error bars represent standard error of means). Single asterisk (*) indicates (p < 0.05) and Triple asterisks (***) indicate (p < 0.001).
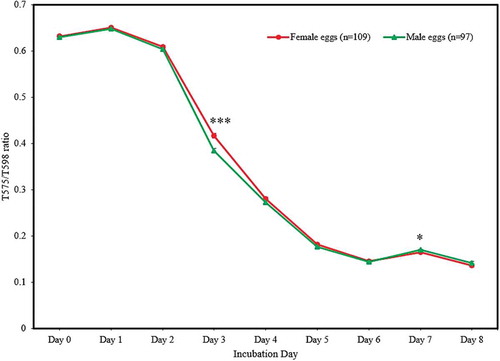
Table 1. Characteristics of hatched egg samples.