Figures & data
Table 1. Primers used for the construction of recombinant expression plasmids
Figure 1. Western blotting and subcellular localisation of GFP-chBRD2 and GFP in DF-1 cells. (a) The western blotting of GFP-chBRD2 and GFP in DF-1 cells. (b) The subcellular localisation of GFP-chBRD2 and GFP in DF-1 cells. Original magnification was 1 × 200
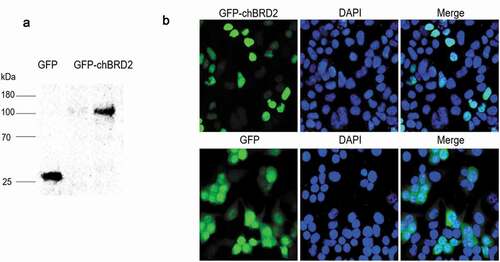
Table 2. Statistical table of protein identification information
Figure 2. The distribution of differentially expressed proteins during GFP-chBRD2 or GFP infection at 36 h. The differential Venn maps of proteins interacting with GFP-chBRD2 or GFP were completed by the online programme. (http://bioinformatics.psb.ugent.be/webtools/Venn/)
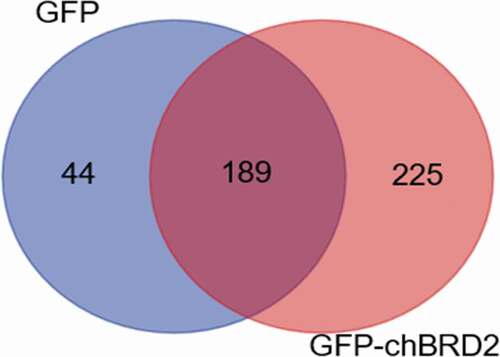
Figure 3. Gene ontology analysis of differentially expressed proteins
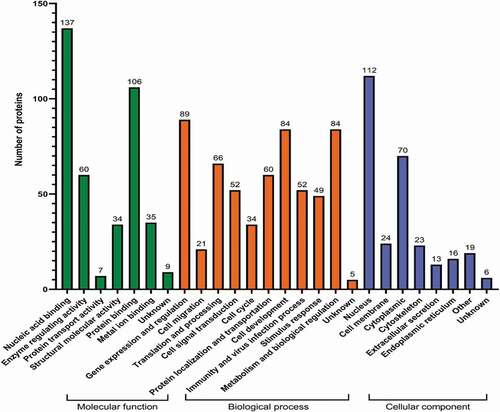
Figure 4. KEGG pathway analysis of differentially expressed proteins (http://www.genom e.jp/kegg/mappe r.html)
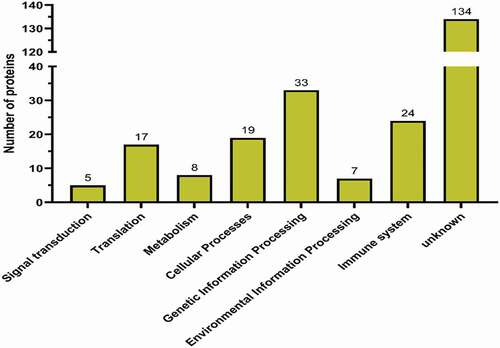
Figure 5. The PPI network diagram of proteins interacting with chBRD2. The colour, from red to yellow, indicates the number of proteins that interact with chBRD2 and a black line indicates that the interaction between the two proteins was predicted (https://string-db.org/cgi/input?sessionId=beWNfFR7fSbZ&input_page_show_search=on)
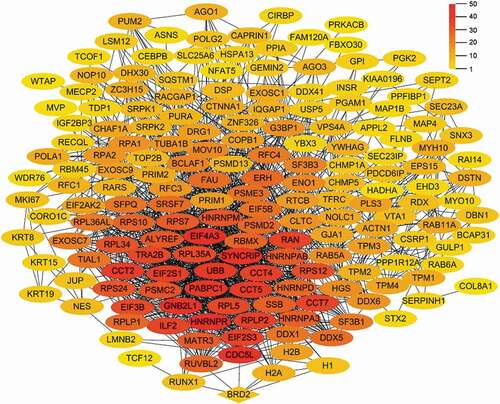
Figure 6. The PPI network diagram of proteins interacting with chBRD2 based on biological function. (a) The PPI network diagram was based on gene expression and regulation. (b) The PPI network diagram was based on cell cycle and cell development. (c) (https://string-db.org/cgi/input?sessionId=beWNfFR7fSbZ&input_page_show_search=on). The red line indicates the gene fusions evidence; the blue line gene co-occurrence evidence; the light blue line database evidence; the purple line experimental evidence, the light green text mining evidence; the green line neighbourhood evidence; the black line co-expression evidence and the light purple protein homology evidence
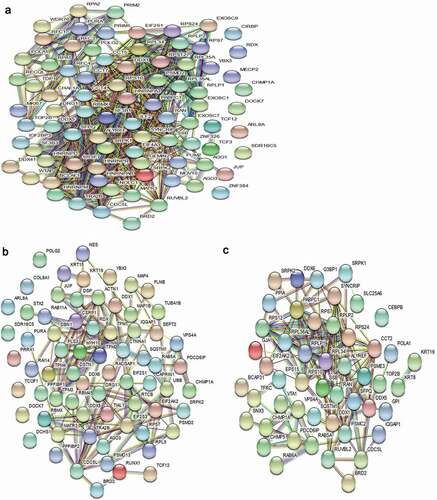
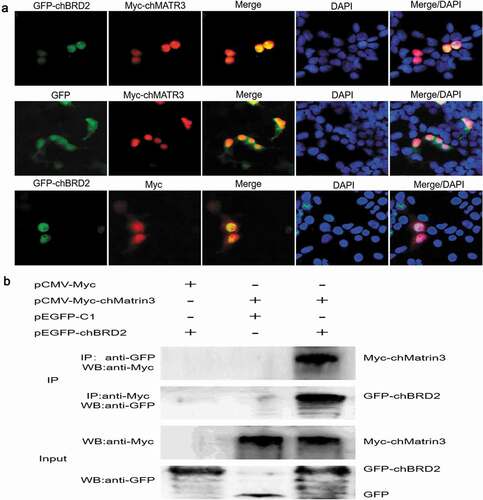
Figure 7. Identification of interaction between chBRD2 and chMATR3 by fluorescence co-localisation and Co-IP assays. (a) Co-localisation of chBRD2 and chMATR3 in plasmids co-transfected DF-1 cells. Original magnification was 1 × 200. (b) Co-IP assay was used to verify the interaction between chBRD2 and chMATR3