Figures & data
Table 1. Ingredient and calculated nutrient content (g/kg, as fed basis) of the basal negative control diets, by phase1
Table 2. Analysed nutrient content and phytase activities of the treatment diets, by phase
Table 3. Apparent ileal digestibility (AID) of IP6, sum IP3-6 and P at 21 d of age1
Table 4. Ileal content (g/100 g DM) of individual IP3-6 esters at 21 days of age1
Figure 1. Fitted exponential curves for the relationships between ileal IP6–P (a), IP5–P (b) and IP4–P (c) content (g/100 g of digesta freeze-dried DM) and the analysed phytase dose level in diets of varying phytate-P level, measured at 21 days of age1.
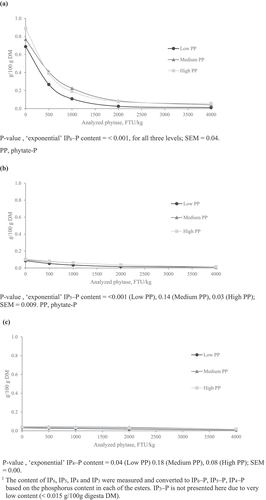
Table 5. Calculated dietary content (g/kg diet) of ileal digestible P and sum of IP3-6 – P at 21 d of age1
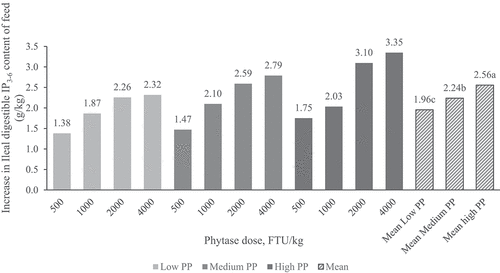
Figure 2. Calculated increase (above NC) in ileal digestible IP3-6–P content (g/kg feed) of diets with low, medium or high dietary phytate-P content and phytase added at different dose levels, determined in broilers at 21 d of age.