842
Views
16
CrossRef citations to date
0
Altmetric
Survey article

Survey of recent developments

&
Pages 287-315 | Published online: 16 Nov 2009

Figures & data

FIGURE 1  Economic Growth Rates in Asia (% p.a. year-on-year)

Source: CEIC Asia Database.

FIGURE 1  Economic Growth Rates in Asia (% p.a. year-on-year) Source: CEIC Asia Database.

FIGURE 2  Government Social Expenditure a

(Rp trillion/quarter)

a Amounts for the September and December quarters in 2009 are projections.

Source: Agency for Fiscal Policy, Ministry of Finance.
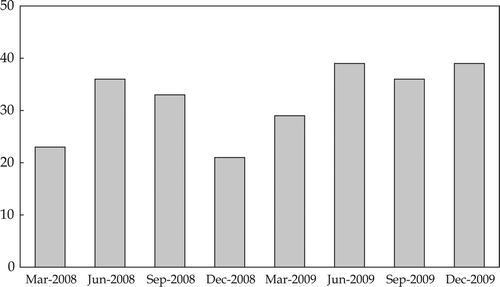
FIGURE 2  Government Social Expenditure a (Rp trillion/quarter) a Amounts for the September and December quarters in 2009 are projections. Source: Agency for Fiscal Policy, Ministry of Finance.

TABLE 1a Components of GDP Growth (2000 prices; % year on year)

TABLE 1b Components of GDP Growth (2000 prices; seasonally adjusted; % quarter on quarter)

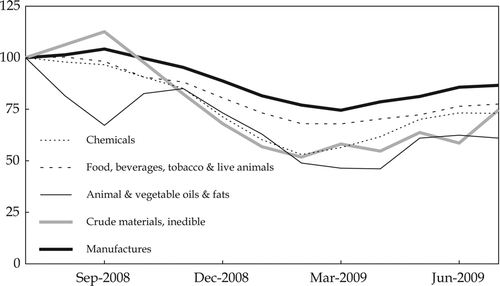
FIGURE 3a  Exports
($ values, 3-month rolling sum, July 2008 = 100))

FIGURE 3a  Exports ($ values, 3-month rolling sum, July 2008 = 100))

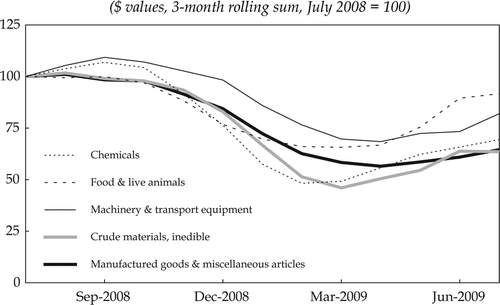
FIGURE 3b  Imports
($ values, 3-month rolling sum, July 2008 = 100)

Source: CEIC Asia Database.

FIGURE 3b  Imports ($ values, 3-month rolling sum, July 2008 = 100) Source: CEIC Asia Database.

TABLE 2 Regional Economic Growth (2000 prices, % year on year)

TABLE 3 Balance of Payments ($ billion per quarter)

FIGURE 4  Composite Stock Price Index (CSPI) and Exchange Rate

Source: Indonesia Stock Exchange; Pacific Exchange Rate Service.
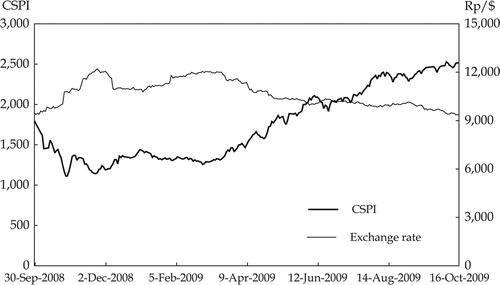
FIGURE 4  Composite Stock Price Index (CSPI) and Exchange Rate Source: Indonesia Stock Exchange; Pacific Exchange Rate Service.

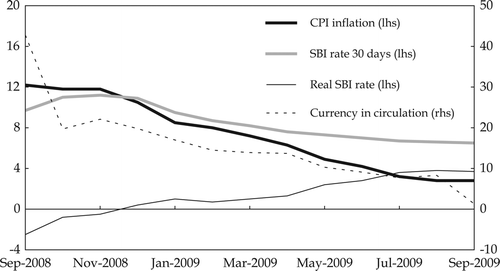
FIGURE 5  Monetary Policy and Inflation(% p.a.)

Source: CEIC Asia Database.

FIGURE 5  Monetary Policy and Inflation(% p.a.) Source: CEIC Asia Database.

TABLE 4 Composition of the Labour Forcea (%)

TABLE 5 Household Income per Capitaa (Rp ‘000, 2008 prices)

TABLE 6 Regional Poverty Levelsa (%)

FIGURE 6  Annual GDP Growth, Unemployment and Poverty under the First SBY Administration (%)

Source: CEIC Asia Database; BPS (Citation2009).
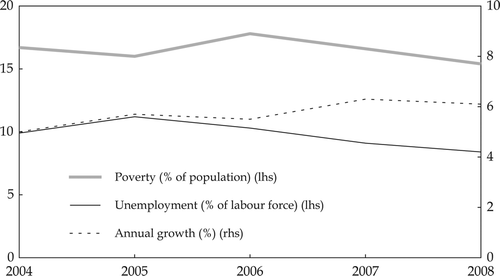
FIGURE 6  Annual GDP Growth, Unemployment and Poverty under the First SBY Administration (%) Source: CEIC Asia Database; BPS (Citation2009).

TABLE 7 Budget Expenditure Plans and Realisation

FIGURE 7  Private Participation in Infrastructure Projects in Indonesia a ($ million)

a Private participation in water and sewerage infrastructure has been negligibly small. These data have been omitted from the chart.

Source: World Bank, Private Participation in Infrastructure database.
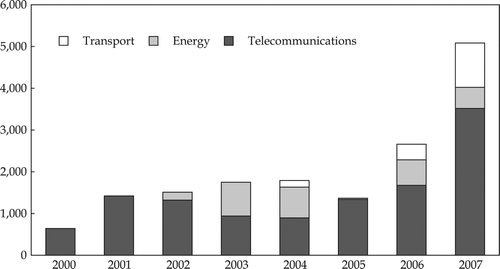
FIGURE 7  Private Participation in Infrastructure Projects in Indonesia a ($ million) a Private participation in water and sewerage infrastructure has been negligibly small. These data have been omitted from the chart. Source: World Bank, Private Participation in Infrastructure database.
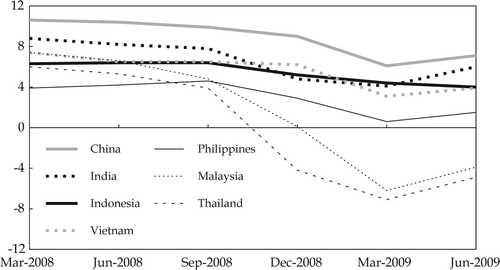
TABLE 8 Length and Density of Roads Before and After the 1997–98 Crisisa

Reprints and Corporate Permissions

Please note: Selecting permissions does not provide access to the full text of the article, please see our help page How do I view content?

To request a reprint or corporate permissions for this article, please click on the relevant link below:

Academic Permissions

Please note: Selecting permissions does not provide access to the full text of the article, please see our help page How do I view content?

Obtain permissions instantly via Rightslink by clicking on the button below:

If you are unable to obtain permissions via Rightslink, please complete and submit this Permissions form. For more information, please visit our Permissions help page.