Figures & data
TABLE 1 Components of GDP Growth (2000 prices; % year on year)
FIGURE 1 Monetary Policy and Inflation, 2011–12 a (% p.a.)
a CPI = consumer price index; SBI = Bank Indonesia Certificate.
Source: CEIC Asia Database.
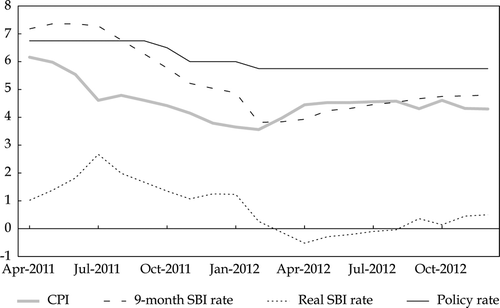
FIGURE 2 Composite Stock Price Index (CSPI) and Exchange Rate, 2011–12
Source: Indonesia Stock Exchange; Pacific Exchange Rate Service.
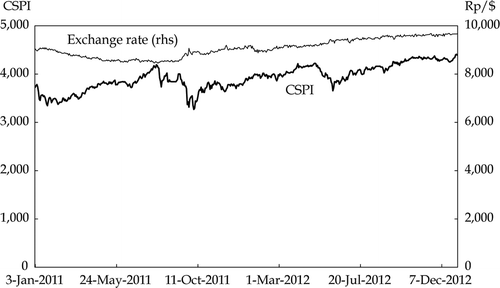
TABLE 2 Balance of Payments ($ billion)
TABLE 3 2012 Budget Outcome and 2013 Budget a (Rp trillion)
TABLE 4 Indonesia's Minimum-Wage Rate, 2012–13 (Rp/year)
FIGURE 3 Average Minimum-Wage Rates in Capital Cities of Selected Asian Countries, 2007–13 ($/month)
Source: Indonesia Stock Exchange; Pacific Exchange Rate Service.
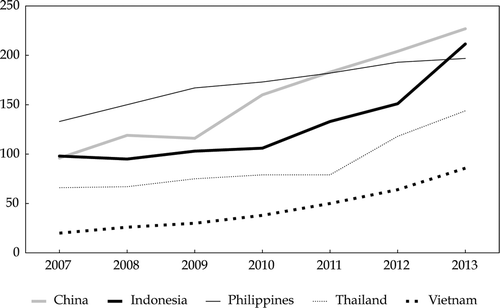
FIGURE 4 Average Nominal Provincial Minimum Wages for Select Major Island Groups, 2004–13 (Rp ‘000/month)
Source: BPS, Perkembangan Beberapa Indikator Utama Sosial-Ekonomi Indonesia (Trends of the Selected Socio-Economic Indicators of Indonesia), 2004–12, and various media reports.
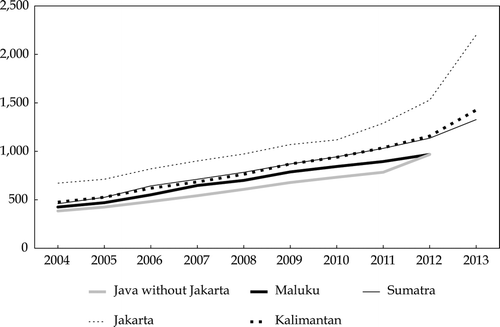
FIGURE 5 Ratio of Provincial Minimum Wage to Minimum Cost of Living, 2004–12a (averages for select major island groups)
a CV = coefficient of variation.
Source: BPS, Perkembangan Beberapa Indikator Utama Sosial-Ekonomi Indonesia (Trends of the Selected Socio-Economic Indicators of Indonesia), 2004–12, and various media reports.
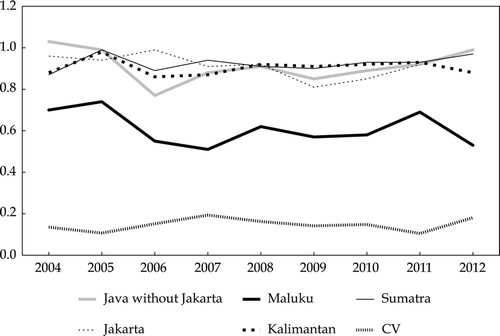
FIGURE 6 Gini Ratio for Indonesia, 2000–12
Source: Calculations based on expenditure data from the National Socio-Economic Survey (Susenas).
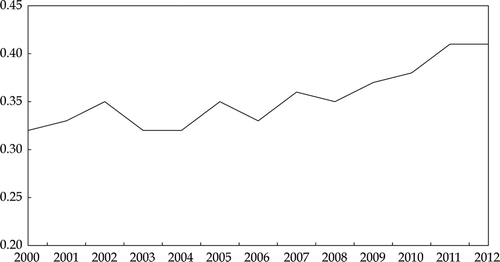
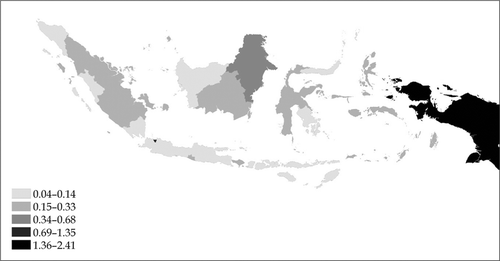
FIGURE 7 HIV Prevalence Rates among the Adult Population, by Province (%)
Source: National AIDS Commission (Citation2011).