10,094
Views
11
CrossRef citations to date
0
Altmetric
Survey of Recent Developments

Family Matters: Demographic Change and Social Spending in Indonesia

&

Figures & data

Table 1. Components of GDP Growth, 2014-16 (% year on year)

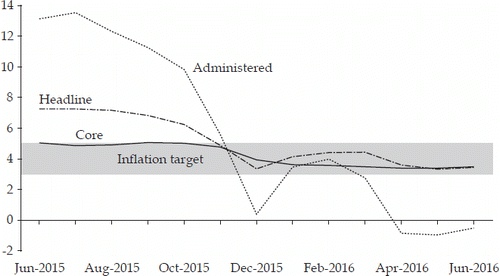
FIGURE 1 Inflation 2015–16 (% year on year)

Source: CEIC Indonesia Premium Database.
FIGURE 1 Inflation 2015–16 (% year on year)

FIGURE 2 Credit Growth and GDP Growth, 2010–16 (% year on year)
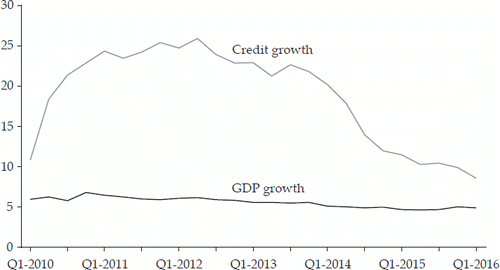
Source: CEIC Indonesia Premium Database.
FIGURE 2 Credit Growth and GDP Growth, 2010–16 (% year on year)

Table 2. Budgets for 2015 and 2016 (Rp trillion)

FIGURE 3 Value-Added Tax and Income Tax Ratios and Growth, 1985–2015

Source: CEIC Indonesia Premium Database.
Note: Income tax refers to non-oil-and-gas income tax. The growth average excludes 1998–2001 because there was a crisis and a change of budget period during that time.
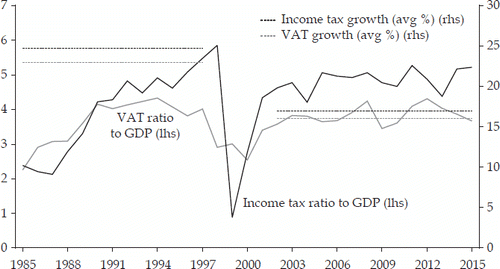
FIGURE 3 Value-Added Tax and Income Tax Ratios and Growth, 1985–2015

Table 3. Indonesia's Tax Amnesty Program

FIGURE 4 Public Spending on Infrastructure and Social Assistance, 2005–15
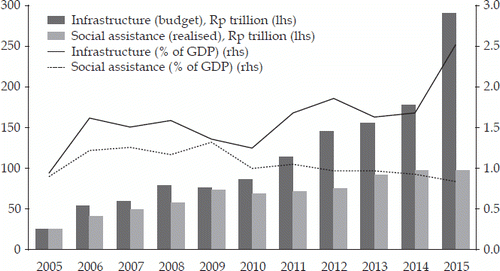
Source: Authors’ calculations based on data from the Ministry of Finance (various years).
FIGURE 4 Public Spending on Infrastructure and Social Assistance, 2005–15

Table 4. JKN Contributions and Claim Ratios by Type of Membership

Table 5. Average Household Size, Indonesia, 1971–2013

Table 6. Distribution of Households and Individuals, by Household Type, 2013 (%)

FIGURE 5 Singulate Mean Age at Marriage, 1995–2013
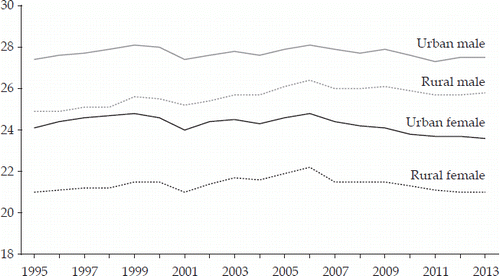
Source: Data from Hull (Citation2016, figure 9.4).
FIGURE 5 Singulate Mean Age at Marriage, 1995–2013

FIGURE 6 Multi-method Estimates of Indonesia’s Total Fertility Rate, 1969–2015
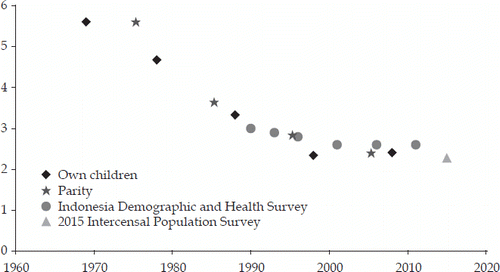
Sources: Data for 1969–2011 from McDonald and Rangkuti (Citation2015); data for 2015 from BPS (pers. comm. 2016).
FIGURE 6 Multi-method Estimates of Indonesia’s Total Fertility Rate, 1969–2015

FIGURE 7 Relative Education of Couples, 1982–2010 (%)

Sources: Data from Susenas 1982, 1992, 2000, and 2010. Based on a standardised classification of five educational groups (individual’s highest completed level of education: less than primary, primary, junior high, senior high, and tertiary) across the four surveys.
Note: These results differ slightly from those of Utomo (Citation2014), who noted a smaller decline in homogamy and a slightly larger decline in hypergamy between 1982 and 2010 when more detailed tertiary education subcategories were used.
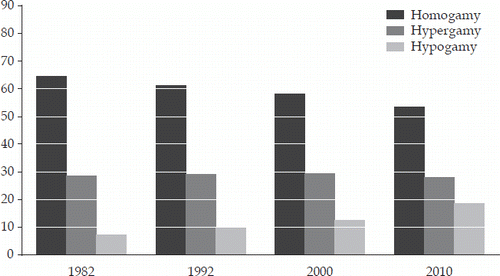
FIGURE 7 Relative Education of Couples, 1982–2010 (%)

FIGURE 8 Muslim Divorces in Islamic Courts, 2001–14 (’000)
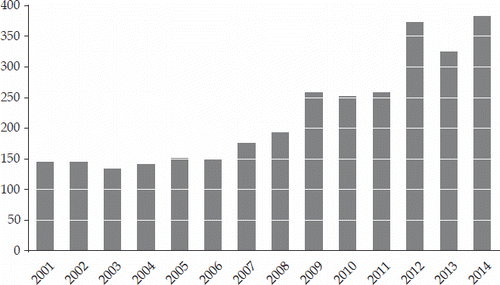
Sources: Data for 2001–9 from Cammack and Heaton (Citation2011, table 3); data for 2010–14 from figures cited in national newspapers.
FIGURE 8 Muslim Divorces in Islamic Courts, 2001–14 (’000)

Reprints and Corporate Permissions

Please note: Selecting permissions does not provide access to the full text of the article, please see our help page How do I view content?

To request a reprint or corporate permissions for this article, please click on the relevant link below:

Academic Permissions

Please note: Selecting permissions does not provide access to the full text of the article, please see our help page How do I view content?

Obtain permissions instantly via Rightslink by clicking on the button below:

If you are unable to obtain permissions via Rightslink, please complete and submit this Permissions form. For more information, please visit our Permissions help page.