
Figures & data
Table 1. Descriptive Statistics
FIGURE 1 Distribution of Expenditure between Parents and Children
Source: Authors’ estimation.
Note: Kernel = epanechnikov, bandwidth = 4.3e+03.
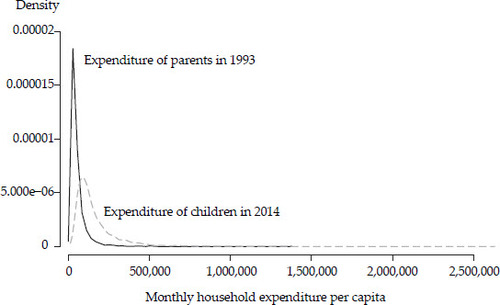
FIGURE 2 Absolute Mobility: Percentage of Children with Weak versus Strong Mobility, by Consumption Quantile
Source: Authors’ estimation.
Note: Strong mobility refers to the condition whereby the children’s consumption quantile is uniformly larger than their parents’ consumption quantile in the national distribution; weak mobility refers to the condition whereby the children’s consumption quantile is equal to or larger than their parents’ consumption quantile in the national distribution.
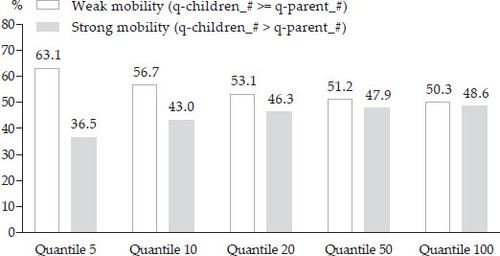
FIGURE 3 Absolute Mobility: Percentage of Children, by Age Cohort, Earning More Than Their Parents, by Expenditure Decile, 1993
Source: Authors’ estimation.
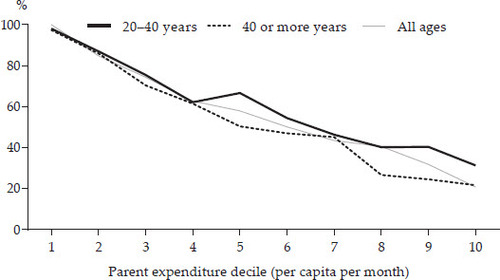
FIGURE 4 Relative Mobility between Quintiles: Parents versus Children
Source: Authors’ estimation.
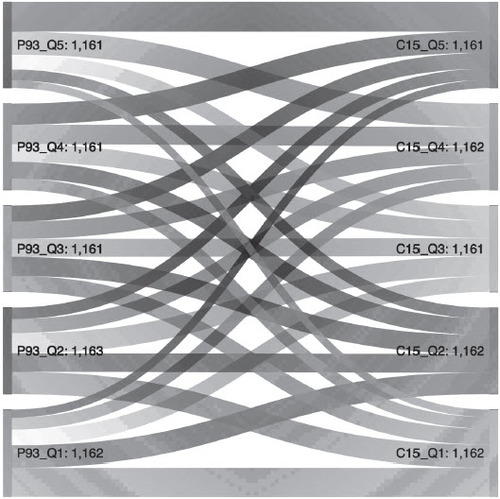
Table 2. Results of Logistic Regression
FIGURE 5 Relative Mobility: Unconditional Quintile Regression (UQR) versus Ordinary Least Square (OLS) Mobility Results
Source: Authors’ estimation.
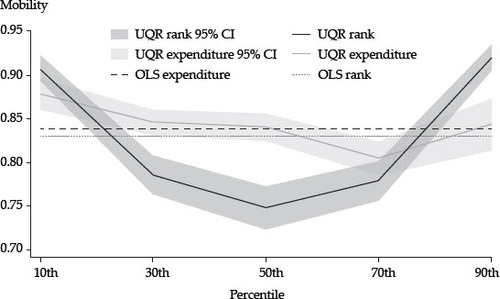
Table 3. Estimation Results of Ordinary Least Square (OLS) and Unconditional Quantile Regression
Table 4. Summary of Robustness Test for Different Specifications