Figures & data
Table 1. Number of Audits and Audit Coverage Ratio for FY 2016–18
FIGURE 1 DGT’s Strategy Map
Source: DGT (2019).
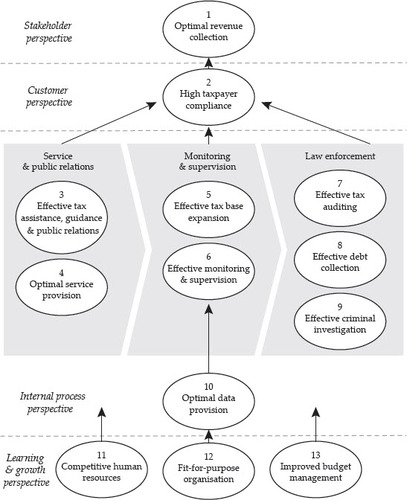
Table 2. Hypotheses under Study
Table 3. Number of Tax Offices in Study
FIGURE 2 Conceptual Framework under Review
Note: The rectangles indicate the observed variables under review (that is, KPIs; 19 in total). SP represents the KPIs from the stakeholder perspective (two KPIs), CP represents the KPIs from the customer perspective (two KPIs), IP represents the KPIs from the internal process perspective (12 KPIs) and LG represents the KPIs from the learning and growth perspective (three KPIs). In this intuitive conceptual model, 64 causal relationships were analysed simultaneously. Note, however, that the emphasis of this study lies in the relationships between KPIs in the internal process and customer perspectives.
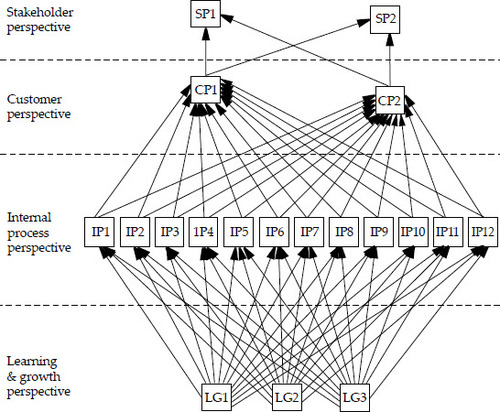
Table 4. KPI Scores (%) (N = 352 tax offices)
Table 5. Variation in Causal Relationships in the DGT’s Strategy Map (N = 352 tax offices)
Table 6. Causal Relationships between the DGT’s Internal Business Process and Tax Compliance
Table 7. Summary of Standardised Direct Effects between Law Enforcement Activities and the Level of Tax Compliance Arising from Hypotheses H1–H8
Table 8. Summary of Standardised Direct Effects between Law Enforcement Activities and the Level of Tax Compliance by Group of Five Main Islands
Table 9. Comparison of Standardised Direct Effects between Law Enforcement Activities and the Level of Tax Compliance between Two Groups of Tax Offices
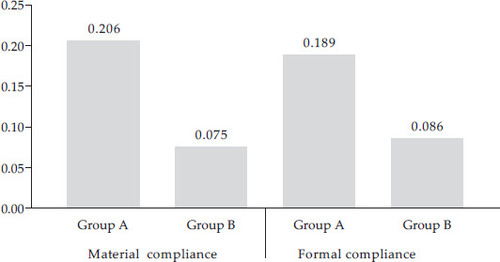
FIGURE 3 Comparison of Standardised Direct Effects of ACR on Level of Compliance between Two Groups of Tax Offices
Note: *** = p ≤ 0.01. Group A represents a group of tax offices having taxpayers being criminally investigated. Group B represents a group of tax offices not having taxpayers being criminally investigated.