
Figures & data
Table 1. Descriptive Statistics of the Growth and Initial Levels of HDI and GDP Per Capita, 2010 and 2018
FIGURE 1 Centroids of 514 Indonesian Districts and Associated Administrative Boundaries
Source: Authors.
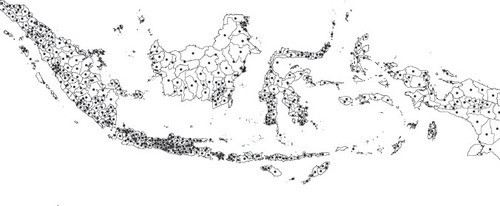
FIGURE 2 Centroids of 514 Indonesian Districts and Associated Thiessen Polygon Boundaries
Source: Authors.
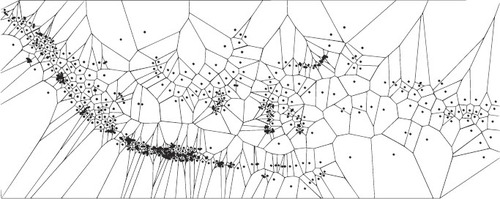
FIGURE 3 Global Spatial Dependence and Sigma Convergence in Social and Economic Performance
Source: Authors.
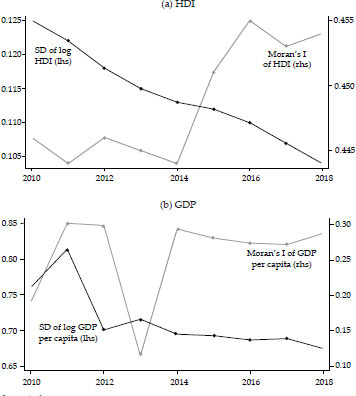
FIGURE 4 Local Indicators of Spatial Association of HDI in 2010
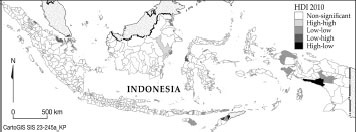
FIGURE 5 Local Indicators of Spatial Association of HDI in 2018
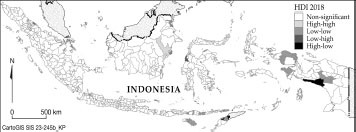
FIGURE 6 Local Indicators of Spatial Association of GDP Per Capita in 2010
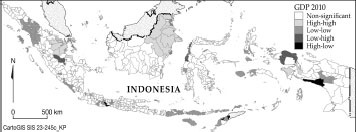
FIGURE 7 Local Indicators of Spatial Association of GDP Per Capita in 2018
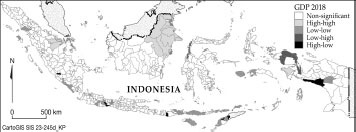
Table 2. Pesaran’s Test of Cross-Sectional Dependence
Table 3. Spatial Dependence Results from the Absolute Convergence Models of HDI
Table 4. Spatial Dependence Results from the Absolute Convergence Models of GDP Per Capita
Table 5. Spatial Dependence in the Conditional Convergence Models of HDI and Determinants
Table 6. Spatial Dependence in the Conditional Convergence Models of GDP per capita and Determinants
Table 7. Comparison of Spatial Durbin Model Using Two Different Weight Matrices
Table 8. Direct and Indirect Effects of Key Variables on HDI and GDP per capita under the Spatial Durbin Model