Figures & data
Table 1. GDP Growth 2022–23 (%, year on year)
FIGURE 1 Rates of Inflation, Administered Prices and Volatile Food (% year on year)
Source: BPS (Statistics Indonesia).
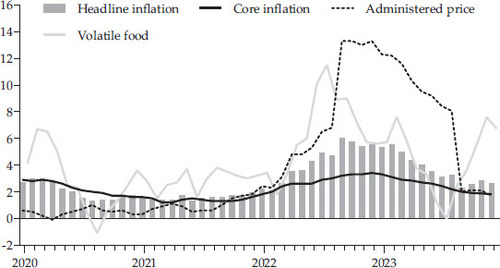
FIGURE 2 Current Account and Key Exports
Source: Trade Map (https://m.trademap.org/#/main) and BPS.
Note: * The 2023 value in a is for Q1–Q3.
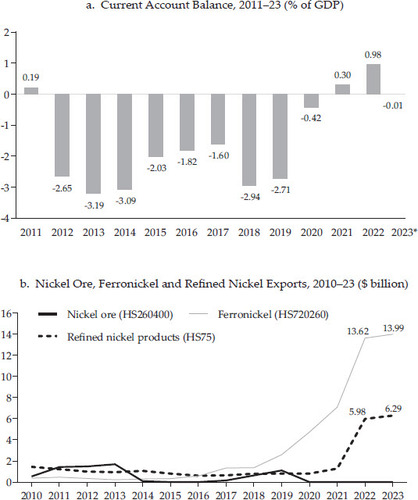
FIGURE 3 Indonesia’s Trade with China
Source: Trade Map (https://m.trademap.org/#/main) and BPS.
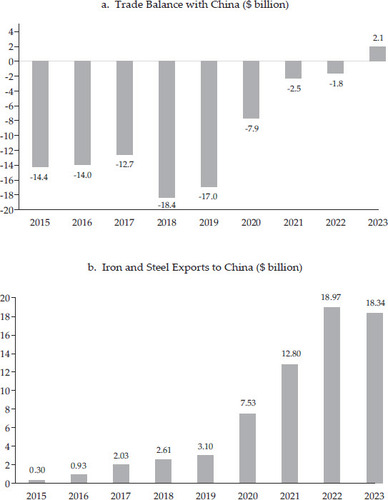
Table 2. Balance of Payments 2021–23 ($ billion)
FIGURE 4 Credit Growth by Loan Purpose (%, year on year)
Source: CEIC (https://www.ceicdata.com/en).
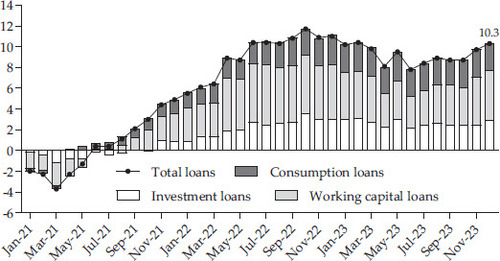
FIGURE 5 Financial Market Development ($ billion)
Source: CEIC (https://www.ceicdata.com/en).
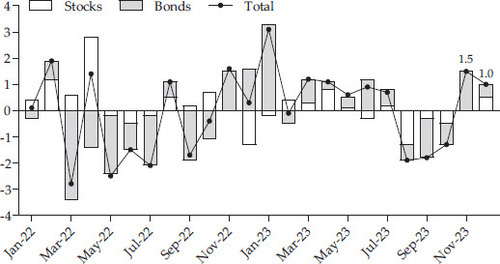
FIGURE 6 Social Protection Budget
Source: Ministry of Finance (2023).
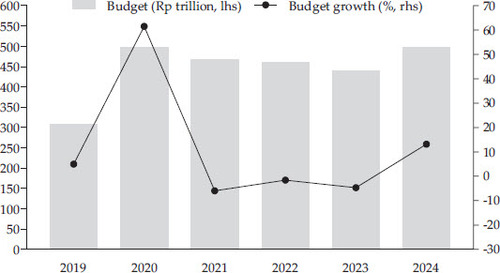
FIGURE 7 Poverty Figures and Targets, 2004–23
Source: BPS various years.
Note: The poverty numbers for 2011–13 were reproduced in 2013 using a new weight from the population census of 2010. The target rate was set under the National Long-Term Development Plan (RPJMN).
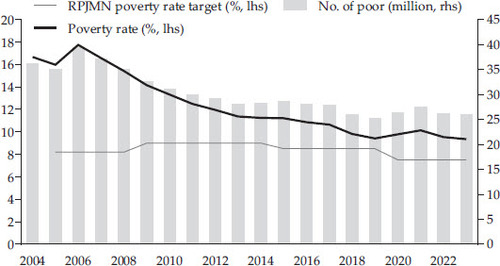
FIGURE 8 Growth Incidence Curve (GIC) (real)
Source: Susenas 2016, 2019, 2020 and 2023.
Note: Average growth in a and 8b is geometric growth. The GIC shows the annualised growth rate of per capita expenditure for every percentile of expenditure between two points in time.
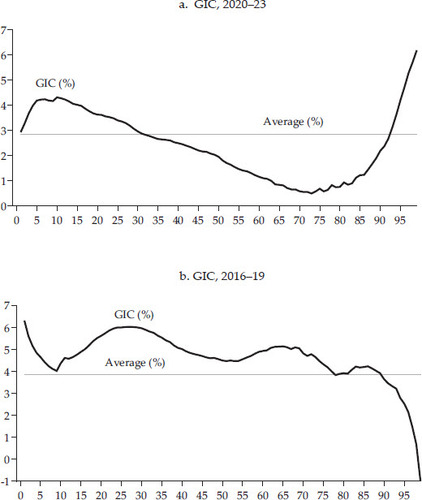
Table 3. Budget Performance, 2021–23 (Rp trillion)
FIGURE 9 Fiscal Deficit and Debt Ratio of Selected Countries
Source: Ministry of Finance of Indonesia and IMF.
Note: * 2023 values comprise realisation values for Indonesia and IMF forecasts for other countries.
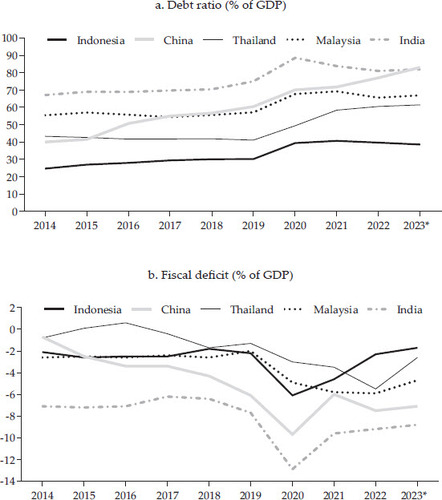
Table 4. The 2024 Budget Posture (Rp trillion)
FIGURE 10 Indonesia Crude Price and Energy Subsidy
Source: Ministry of Finance of Indonesia.
Note: * 2023 values are unaudited.
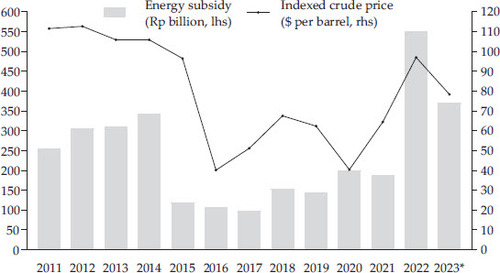
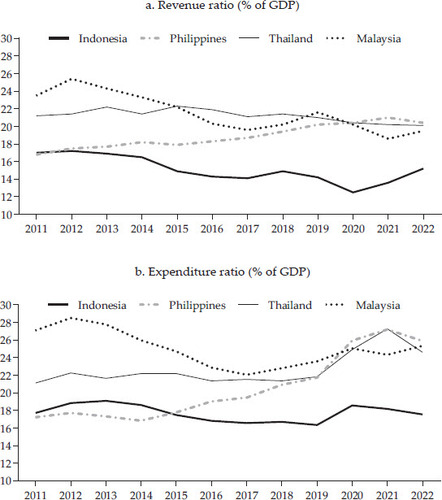
FIGURE 11 Revenue and Expenditure of Selected Southeast Asia Countries
Source: IMF (2023b).