Figures & data
Table 1. Summary of reagents mentioned in literature.
Figure 1. Examples of seasonal drop: (a) in gold recovery on Hudson Bay Mining and Smelting, 2000–2003; (b) in Cu + Ni grade on Clarabelle mill, adapted from Refs. [Citation28,Citation63].
![Figure 1. Examples of seasonal drop: (a) in gold recovery on Hudson Bay Mining and Smelting, 2000–2003; (b) in Cu + Ni grade on Clarabelle mill, adapted from Refs. [Citation28,Citation63].](/cms/asset/f01ec768-04e3-4ceb-8adf-815ae1bd2912/ycmq_a_2127788_f0001_oc.jpg)
Figure 2. (a) DO solubility in distilled water at different temperatures, adapted from Ref. [Citation90]; (b) effect of temperature on water viscosity and bubble size, adapted from Ref. [Citation91].
![Figure 2. (a) DO solubility in distilled water at different temperatures, adapted from Ref. [Citation90]; (b) effect of temperature on water viscosity and bubble size, adapted from Ref. [Citation91].](/cms/asset/4cce6af5-24ff-459d-ba1a-8eb4d1d005fe/ycmq_a_2127788_f0002_oc.jpg)
Figure 3. Zinc concentrate grade fluctuations at Matagami concentrator, adapted from Ref. [Citation64].
![Figure 3. Zinc concentrate grade fluctuations at Matagami concentrator, adapted from Ref. [Citation64].](/cms/asset/ebaecc68-fc62-4441-a860-bb4c4f5d9ef0/ycmq_a_2127788_f0003_oc.jpg)
Figure 4. Monthly pyrite production on a flotation plant in South Africa in relation to the temperature, adapted from [Citation66].
![Figure 4. Monthly pyrite production on a flotation plant in South Africa in relation to the temperature, adapted from [Citation66].](/cms/asset/53093ad4-ffcf-42a7-a3ae-d20ee826da35/ycmq_a_2127788_f0004_oc.jpg)
Figure 5. (a) Concentrate quality depends on froth rheological properties; (b) changes in water and pyrite pulp viscosities, and water surface tension as a function of temperature. Adapted from Refs. [Citation66,Citation92].
![Figure 5. (a) Concentrate quality depends on froth rheological properties; (b) changes in water and pyrite pulp viscosities, and water surface tension as a function of temperature. Adapted from Refs. [Citation66,Citation92].](/cms/asset/40fa99e0-a2c7-42a4-b169-bd3c2e287bb9/ycmq_a_2127788_f0005_oc.jpg)
Figure 6. Flotation recovery of selected sulphide minerals in relation to liquid-vapour surface tension, adapted from Ref. [Citation111].
![Figure 6. Flotation recovery of selected sulphide minerals in relation to liquid-vapour surface tension, adapted from Ref. [Citation111].](/cms/asset/16e7beb2-23c0-4126-ab3f-635bdf70ffed/ycmq_a_2127788_f0006_oc.jpg)
Figure 7. Laboratory results of zinc rougher flotation, adapted from Ref. [Citation128].
![Figure 7. Laboratory results of zinc rougher flotation, adapted from Ref. [Citation128].](/cms/asset/62e641d3-35cc-4667-aa4c-2ce3125bc672/ycmq_a_2127788_f0007_oc.jpg)
Figure 8. Zinc recovery at the Neves-Corvo zinc plant in relation to the daily temperature, adapted from Ref. [Citation132].
![Figure 8. Zinc recovery at the Neves-Corvo zinc plant in relation to the daily temperature, adapted from Ref. [Citation132].](/cms/asset/22820ff3-b431-4b03-989c-fc773addd5c2/ycmq_a_2127788_f0008_oc.jpg)
Figure 9. Interaction scheme of xanthates with sulphide surface in aerated pulp, adapted from Ref. [Citation140], where Ev is the location of the energy level of the valence band ‘ceiling’, and Ec is the location of the energy level of the conductivity band ‘bottom’.
![Figure 9. Interaction scheme of xanthates with sulphide surface in aerated pulp, adapted from Ref. [Citation140], where Ev is the location of the energy level of the valence band ‘ceiling’, and Ec is the location of the energy level of the conductivity band ‘bottom’.](/cms/asset/c5cefd4d-0611-4763-beab-7e76333bdb7f/ycmq_a_2127788_f0009_oc.jpg)
Figure 10. (a) Butyl xanthate adsorption on pyritic surface, adapted from Ref. [Citation32]; (b) change of butyl xanthate concentration in the pulp (Ct/C0) with time during adsorption onto chalcopyrite, adapted from Ref. [Citation145].
![Figure 10. (a) Butyl xanthate adsorption on pyritic surface, adapted from Ref. [Citation32]; (b) change of butyl xanthate concentration in the pulp (Ct/C0) with time during adsorption onto chalcopyrite, adapted from Ref. [Citation145].](/cms/asset/763a5db7-5518-4ef9-898f-8453afa012f9/ycmq_a_2127788_f0010_oc.jpg)
Figure 11. Areas of pH and concentration stabilities of copper species at different temperatures, adapted from Ref. [Citation86].
![Figure 11. Areas of pH and concentration stabilities of copper species at different temperatures, adapted from Ref. [Citation86].](/cms/asset/1a3045b1-b413-4d4d-898e-57bfc5bdf93e/ycmq_a_2127788_f0011_oc.jpg)
Figure 12. Critical cyanide concentrations in captive bubble tests for combinations of activator and collector at different pH and under varying temperature conditions: (a) chalcopyrite (25 mg L−1 KEX), (b) sphalerite (150 mg L−1 Cu-vitriol), (c) pyrite, adapted from Ref. [Citation34].
![Figure 12. Critical cyanide concentrations in captive bubble tests for combinations of activator and collector at different pH and under varying temperature conditions: (a) chalcopyrite (25 mg L−1 KEX), (b) sphalerite (150 mg L−1 Cu-vitriol), (c) pyrite, adapted from Ref. [Citation34].](/cms/asset/d3bd25e7-7137-4156-a75b-44d84bec6ab6/ycmq_a_2127788_f0012_oc.jpg)
Figure 13. A summary of some seasonality triggering mechanisms on sulphide flotation plants.
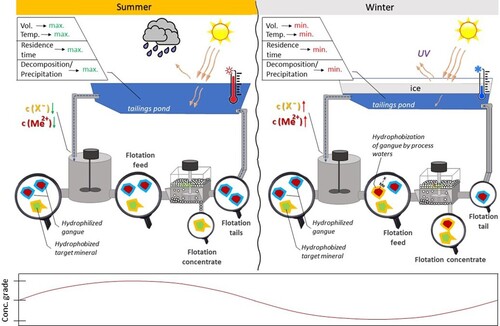
Figure 14. Schematic representation of PNIPAM haematite flotation steps, with results compared with sodium oleate flotation, adapted from Ref. [Citation37].
![Figure 14. Schematic representation of PNIPAM haematite flotation steps, with results compared with sodium oleate flotation, adapted from Ref. [Citation37].](/cms/asset/5ed04387-3d36-49a1-8f5c-34d0e94f5a25/ycmq_a_2127788_f0014_oc.jpg)
Figure 15. Seasonal variations of niobium recovery at Niobec facilities, adapted from Ref. [Citation62]: months with negative recovery shift have blue bars, with positive shift having red bars, months with close to zero shift (<1%) have yellow bars or no bars. The zero point is mean summer recovery.
![Figure 15. Seasonal variations of niobium recovery at Niobec facilities, adapted from Ref. [Citation62]: months with negative recovery shift have blue bars, with positive shift having red bars, months with close to zero shift (<1%) have yellow bars or no bars. The zero point is mean summer recovery.](/cms/asset/dd7e33a1-e24a-47a5-b2dd-17d90749e366/ycmq_a_2127788_f0015_oc.jpg)
Figure 16. Effect of flotation temperature on fluorite grade and recovery at pH 9 with oleic acid, adapted from [Citation188].
![Figure 16. Effect of flotation temperature on fluorite grade and recovery at pH 9 with oleic acid, adapted from [Citation188].](/cms/asset/a841a50f-8e6a-4766-80be-7a73da9a3559/ycmq_a_2127788_f0016_oc.jpg)
Figure 17. Fluorite recovery as a function of pulp temperature and collector type, adapted from Ref. [Citation47].
![Figure 17. Fluorite recovery as a function of pulp temperature and collector type, adapted from Ref. [Citation47].](/cms/asset/1181c453-c47c-4cd6-95df-14d2171f8d31/ycmq_a_2127788_f0017_oc.jpg)
Figure 18. Comparison of the composition of a commercial fatty acid collector and EV-1, plotted using data from Ref. [Citation50].
![Figure 18. Comparison of the composition of a commercial fatty acid collector and EV-1, plotted using data from Ref. [Citation50].](/cms/asset/66de17c6-7da4-4d16-a5f1-33931578ac6e/ycmq_a_2127788_f0018_oc.jpg)
Figure 19. Solubility surfaces for (a) halite and (b) sylvite as a function of MgCl2 and temperature (in a system with NaCl:KCl ratio of 1:1), adapted from Ref. [Citation206].
![Figure 19. Solubility surfaces for (a) halite and (b) sylvite as a function of MgCl2 and temperature (in a system with NaCl:KCl ratio of 1:1), adapted from Ref. [Citation206].](/cms/asset/53bbb62f-af34-4e1a-94ba-e68ea06254d0/ycmq_a_2127788_f0019_oc.jpg)
Figure 20. Recovery and grade of lithium concentrate at different temperatures of the flotation pulp, adapted from Ref. [Citation237].
![Figure 20. Recovery and grade of lithium concentrate at different temperatures of the flotation pulp, adapted from Ref. [Citation237].](/cms/asset/e3ed8f82-13e1-4027-aba1-b4cdeac6182d/ycmq_a_2127788_f0020_oc.jpg)
Table 2. Summary of some reported optimal flotation temperatures for different minerals.
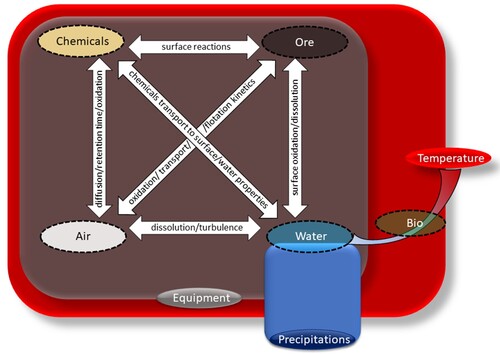
Figure 21. A concept of ‘flotation rectangular’ demonstrates seasonal triggers sphere of influence and flotation system components interactions.