Figures & data
Table 2. Incidence of in vivo chromosomal aberrations recorded in the bone marrow cells of Rattus norvegicus exposed to multiple doses of dichlorophene
Table 1. Micronuclei scoring in bone marrow cells of Rattus norvagicus treated in vivo with different doses of Dicholorophene
Figure. 1 Multiple concentration and duration-dependent profiles of (MN) by dichlorophene at different intervals in Rattus norvegicus along with their standard percent error depicted by error bars. Normal control (distilled water); positive control (cyclohosphamide); DCP1 (66.9 mg); DCP2 (133.8 mg); DCP 3 (200.7 mg); *Statistically significant values at 0.05.
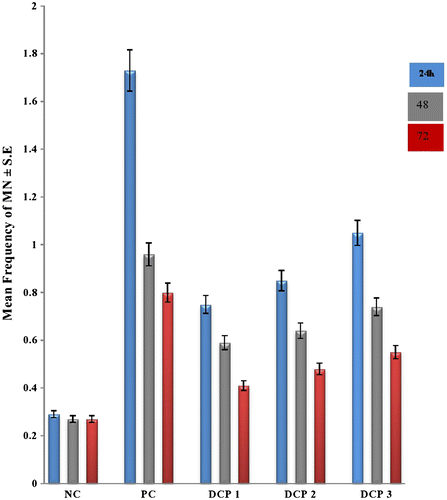
Figure. 2 Multiple concentrations and duration-dependent profiles of (CAs) by dichlorophene at different intervals in Rattus norvegicus along with their standard percent error depicted by error bars. Normal control (distilled water); positive control (cyclohosphamide); DCP1 (66.9 mg/kg bw); DCP2 (133.8 mg/kg bw); DCP 3 (200.7 mg/kg bw); *Statistically significant values at 0.05.
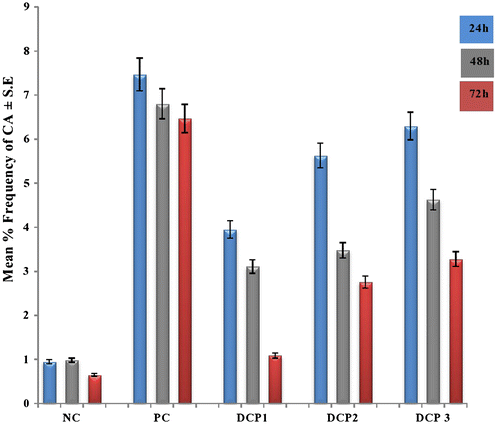
Table 3. Incidence of in vivo chromosomal aberrations recorded in the bone marrow cells of Rattus norvegicus exposed to multiple doses of dichlorophene
Figure. 3 Multiple concentrations and duration-dependent profiles of (MI) by dichlorophene at different intervals in Rattus norvegicus along with their standard percent error depicted by error bars. Normal control (distilled water); positive control (cyclohosphamide); DCP1 (66.9 mg/kg bw; DCP2 (133.8 mg/kg bw); DCP 3 (200.7 mg/kg bw); *Statistically significant values at 0.05.
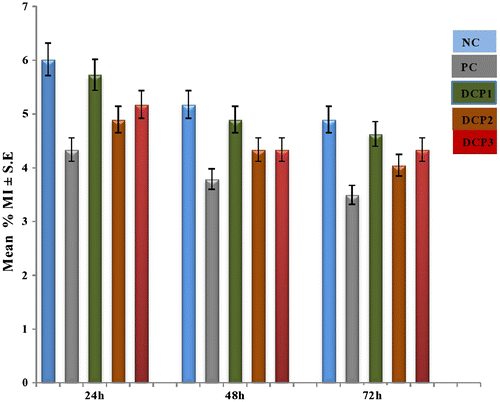
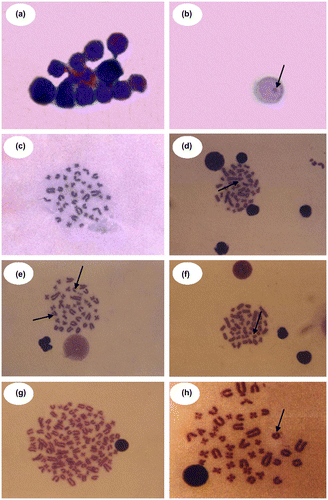
Figure 4 (Color online) Photomicrograph showing polychromatic erythrocytes (a) and micronucleated cell (b) in the bone marrow cells of Rattus norvegicus treated in vivo with different doses of dicholorophene intraperitoneally and metaphase plates of bone marrow cells for different types of chromosomal aberrations with dicholorophene (c–h); (c) Normal metaphase; (d) Dicentric; (e) Acentric fragment and Gap; (f) Break; (g) Polyploidy; (h) Ring (100X oil immersion lens).